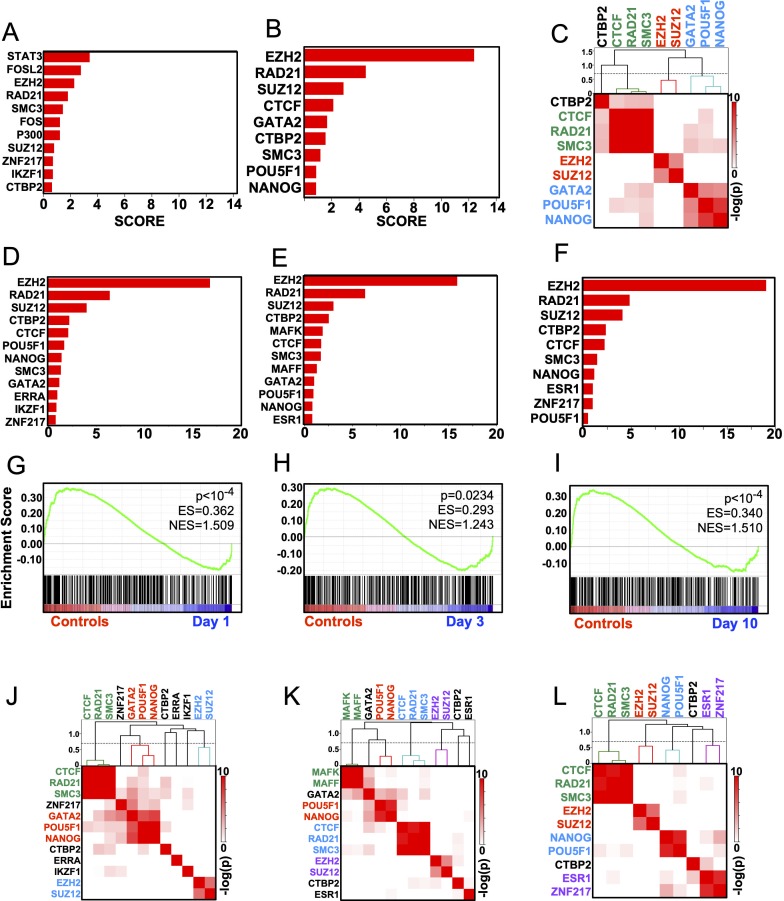
Fig 2. EZH2 drives gene change repression in the early latent period.
A) Genes upregulated at both days 1 and 10 are enriched for STAT3 ChIP peaks across ENCODE ChIP-seq profiles. B) Persistently repressed genes are enriched for EZH2 peaks across ENCODE ChIP-seq profiles. C) Overlaps between lists of target genes for each significant Factor are plotted as a heatmap based on Fisher Exact test p values. Clustering by Pearson distance highlights 3 groups of factors controlling persistently repressed genes. Dashed line cutting branches of the hierarchy tree at Pearson distance = 0.7 (Pearson correlation = 0.3). D-F) Factor analysis highlights EZH2 as the principle driver of repression 1d, 3d or 10d post SE. G-I) GSEA shows EZH2 target genes are enriched in control samples and depleted in repressed genes 1d, 3d or 10d post SE. J-L) Fisher Exact tests of driven genes 1d, 3d or 10d post SE shows EZH2 and SUZ12 co-target genes at all 3 timepoints.

