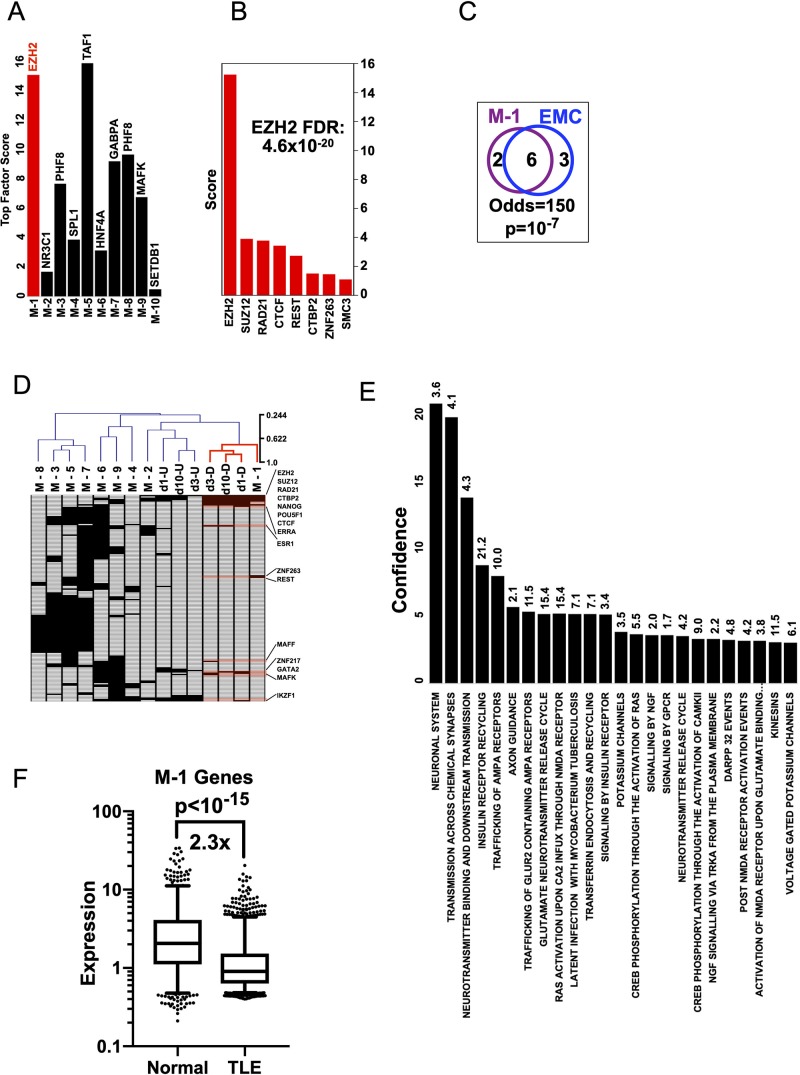
Fig 3. EZH2 targets a module of genes in human TLE.
A) Top scoring Factors are plotted for the 10 k-median clusters in human TLE. B) All positive Factors for module M-1. C) Venn diagram of Factors positive for M-1 and positive for down-regulated genes on day-1 in the rodent EMC data with Fisher Exact p value and odds ratio. D) All 10 k-median human TLE modules and rat gene lists for up or down regulated genes on days 1,3 and 10 after SE were clustered based on absence or presence of factors in their respective Factor analyses–only those factors positive for human M-1 or rat days 1,3 and 10 are shown. The complete map with all factors is shown in supplemental S1 Fig. Black box denotes Factor with FDR<5%, white denotes Factor with FDR≥5%. E) Ontological analysis of M-1 using Reactome database (odds ratios shown above each column, Confidence = -log10(FDR). F) Expression of M-1 genes in non-epileptic (‘Normal’) versus TLE human samples.

