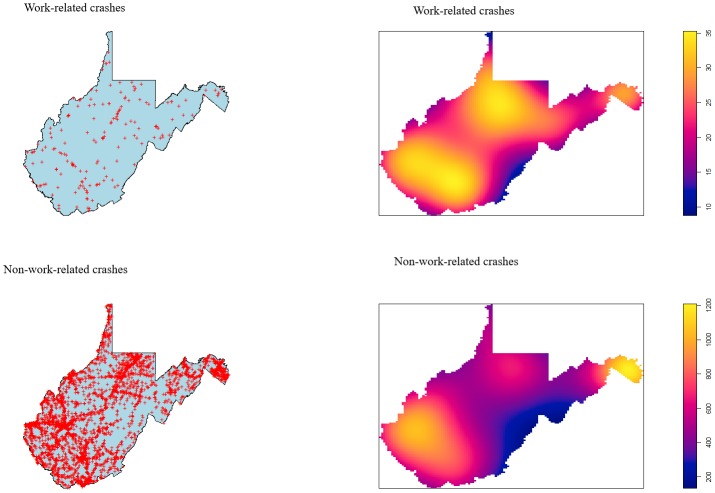
Fig 1. Location and kernel density estimation of work-related and non-work-related fatal collisions in West Virginia, 2000–2017.
Upper-left: Location of work-related crashes; Upper-right: Kernel density estimation of work-related crashes. Lower-left: Location of non-work-related crashes; Lower-right: Kernel density estimation of non-work-related collisions. Areas of purple have low number of fatal crash sites, and bright yellow have a higher number of crash sites.

