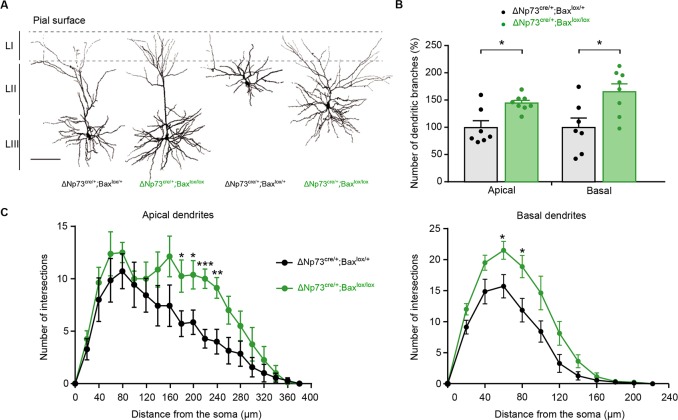
Figure 3. Increased dendritic branches in LII/LIII pyramidal neurons of ΔNp73cre/+;Baxlox/lox mutants.
(A) Representative examples of LII/III pyramidal neurons filled with biocytin in control (P25) and ΔNp73cre/+;Baxlox/lox mutant (P24) somatosensory cortex. (B) Quantification of the number of dentritic branches in control and ΔNp73cre/+;Baxlox/lox mutant LII/III pyramidal neurons, expressed as a percentage of dendritic branches relative to the mean of controls (n = 7 for controls and n = 8 for mutants at P23-28 p=0.0182 for apical dendrites and p=0.014 for basal dendrites; Mann-Whitney U Test). (C) Sholl analysis for the apical and basal dendrites in control and ΔNp73cre/+;Baxlox/lox mutants showing an increased cell complexity between 180 and 240 µm (p-value=0.04, 0.027, 0.0007 and 0.005, respectively) and 60 and 80 µm (p value=0.027 and 0.019, respectively) from the soma, respectively (n = 7 for controls and n = 8 for mutants). Multiple T-test. Scale bar represents 100 μm. Data used for quantitative analyses as well as the numerical data that are represented in graphs are available in Figure 3—figure supplement 1—source data 1.


