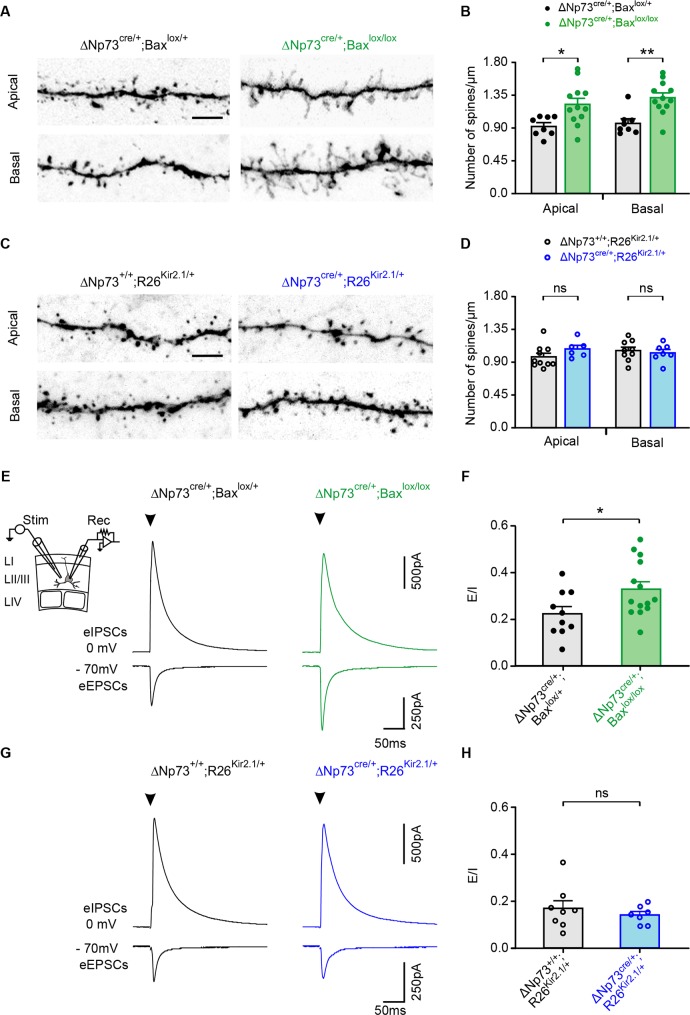
Figure 4. Spine density and evoked synaptic activity recorded in LII/LIII pyramidal neurons in both ΔNp73cre/+;Baxlox/lox and ΔNp73cre/+;R26Kir2.1/+ mutants.
(A, C) Representative confocal images showing spines in apical and basal dendritic segments of controls (left) and ΔNp73cre/+;Baxlox/lox (A, right) and ΔNp73cre/+;R26Kir2.1/+ mutants (C, right) at P24-25. (B, D) Quantification of the spine density (number of spines/µm) in apical and basal dendrites in LII/LIII pyramidal neurons for both controls and mutants from the same litters (for ΔNp73cre/+;Baxlox/lox apical and basal dendrites: n = 8 for controls and n = 12 for mutants at P23-28, p=0.012 for apical dendrites and p=0.0014 for basal dendrites; for ΔNp73cre/+;R26Kir2.1/+ apical dendrites: n = 10 for controls and n = 6 for mutants at P23-P29, p=0.166; basal dendrites: n = 9 for controls and n = 7 for mutants, p=0.652; Mann-Whitney U Test). Scale bar represents 5 μm. (E, G) Pyramidal neurons recorded in voltage-clamp at −70 mV and 0 mV in control at P26 (E, left) and P24 (G, left) and in a ΔNp73cre/+;Baxlox/lox mutant at P23 (E, right) and a ΔNp73cre/+;R26Kir2.1/+ mutant at P28 (G, right) during the extracellular stimulation of LII/III fibers as indicated (E, inset). Stimulation artefacts were blanked for visibility. The stimulation time is indicated (arrowheads). (F, H) Plots of E/I ratio calculated from eEPSCs and eIPSCs in controls and ΔNp73cre/+;Baxlox/lox mutants (F) and ΔNp73cre/+; R26Kir2.1/+ mutants (H) (for ΔNp73cre/+;Baxlox/lox: n = 10 for controls and n = 14 for mutants, p=0.031, Student T Test; for ΔNp73cre/+;R26Kir2.1/+: n = 8 for controls and n = 7 for mutants, p=0.612; Mann-Whitney U Test). Data used for quantitative analyses as well as the numerical data that are represented in graphs are available in Figure 4—figure supplement 1—source data 1.


