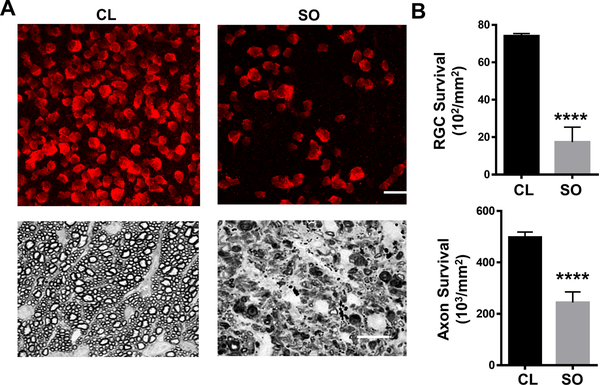
Figure 2. Glaucomatous RGC soma and axon degeneration in SOHU eyes.
(A) Upper panel, the peripheral region of whole-mounted retinas showing RBPMS+ RGCs (red) at 8 weeks after SO injection. Scale bar, 20 μm. Lower panel, semi-thin images of cross sections of optic nerve stained with PPD at 8 weeks after SO injection. Scale bar, 10 μm. (B) Quantification data of surviving RGCs in the peripheral retina (n=12) and axons in optic nerve (n=10) at 8 weeks after SO injection compared to contralateral control (CL) eyes. Data are presented as means ± S.E.M. ****: P<0.0001; Student’s paired t test.

