
Figure 1.
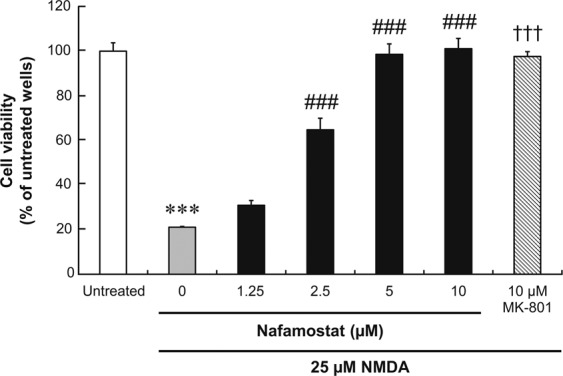
The concentration–response relationship for the neuroprotective effects of nafamostat against NMDA-induced cell death in primary rat cortical neurons. Neurons were incubated for 2 h simultaneously with nafamostat and NMDA, and cell viability was assessed using MTS assays. Absorbance in each well was normalised to that in the untreated wells (Untreated; medium alone) and presented as percentages. Each value represents the mean ± S.E. of six replicates. ***P < 0.001, compared with untreated control; †††P < 0.001, compared with NMDA alone by Aspin–Welch’s t-test. ###P < 0.001, compared with NMDA alone by Dunnett’s multiple comparison test.