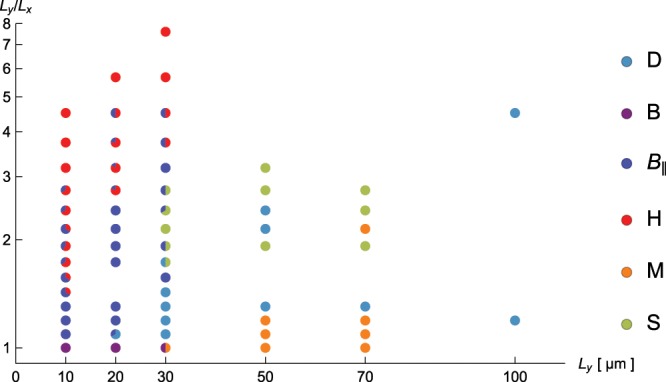
Figure 3.

The diagram of states of fd-viruses in quasi-2D tactoid-shaped confinement, with system-size given by Ly on the x-axis and aspect ratio Ly/Lx on the y-axis. Patterns are color-coded according to the legend on the right, where for clarity all sub-types of D, S and M patterns were labeled with the same color. Bi-colored points encode the relative frequency of occurrence of the types of patterns corresponding to the colors. For each point in the diagram, we analyzed between 1 and 6 wells.
