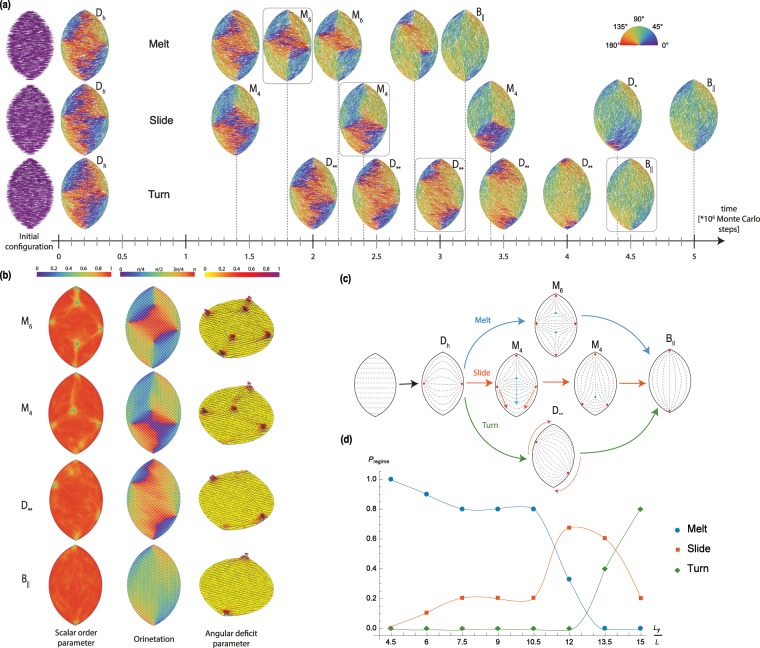
Figure 4.
Melting trajectories. (a) Snapshots taken along the three equilibration pathways. (b) Scalar order parameter, nematic director and disclination parameter for some of the representative states corresponding to the framed configuration in panel (a). (c) Schematic showing the relocation of defects along the pathways. (d) Probability of appearance of the three pathways as a function of the width of the box. Curves are guidelines to the eye. Ten independent runs were performed for each Ly/L. For all simulations presented in this figure L/d = 20, Ly/Lx = 1.5. For each of the three pathways: Ly/L = 12 (melt), Ly/L = 13.5 (slide), and Ly/L = 15 (turn).

