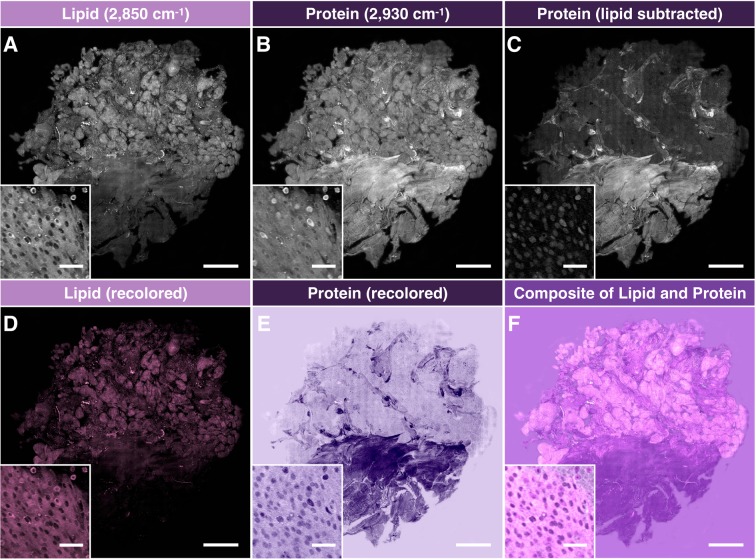
Figure 2.
Image processing of stitched SRS imaging data (Meningioma, WHO grade I). (A) Stitched field-normalized data for lipid channel. (B) Stitched field-normalized data for protein channel. (C) Lipid data subtracted from protein, utilizing lipid and protein images in (A,B). (D) Recoloring result of lipid data. (E) Recoloring result of protein data. (F) Composite image of (D,E). Whole tissue scale bar: 1 mm. Inset scale bar: 50 μm.

