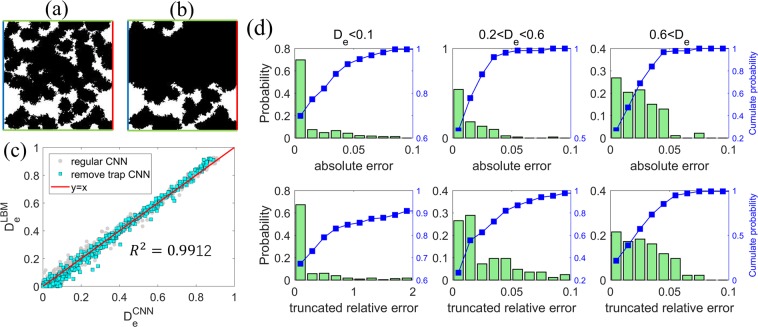
Figure 7.
Improving CNN prediction by preprocessing images of porous structures. (a,b) Images of the regular (a) and processed (b) porous structure by removing the trapped pore space and dead-end transport pathways. The blue (red) lines on denote the inlet (outlet) of the molecule transport through the porous structure. The green lines denote the periodic boundaries. (c,d) The effective diffusivity predicted by the CNN model using the preprocessed image of porous structures (c) and the distribution of their absolute and truncated relative errors (d).

