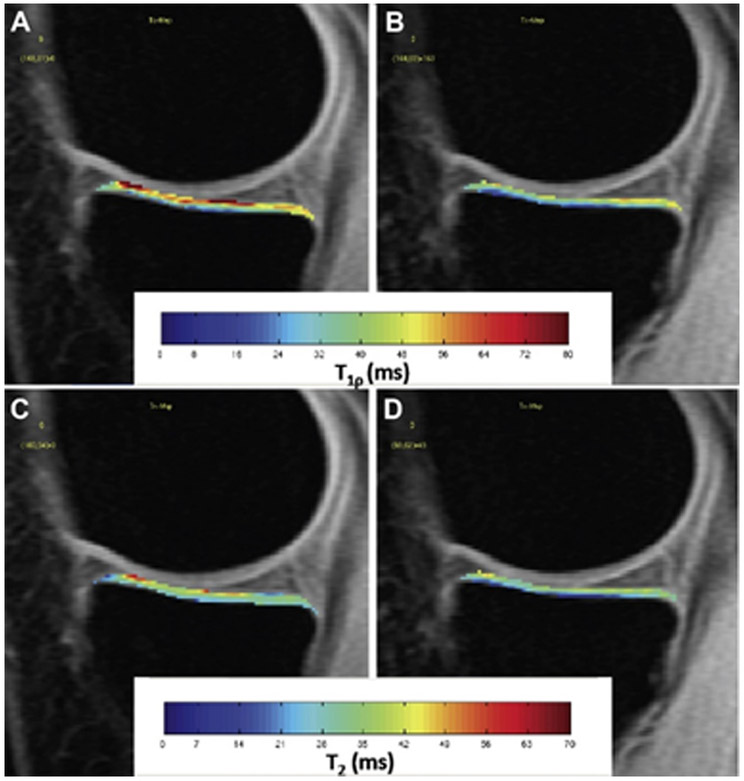
Figure 3:
Representative T1ρ (top row) and T2 (bottom row) maps of the medial tibial cartilage in the unloaded (A, C) and loaded (B, D) conditions. The figure is a figure previously presented by Souza et al. [47]. The reprinting permission is granted through Rightslink system.

