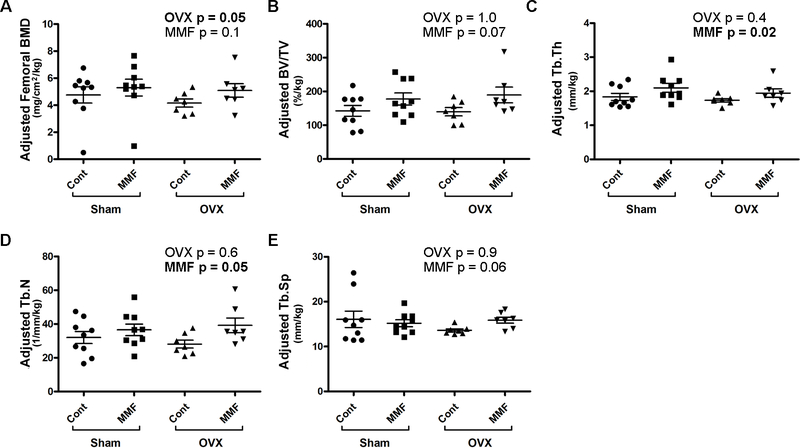
Figure 7. MMF improved trabecular bone microarchitecture.
After sacrifice femora were harvested and the trabecular bone analyzed by µCT as described in Methods. The trabecular bone parameters were adjusted based on body weight (in kg) of each mouse and are illustrated: (A) adjusted femoral BMD (in 100 slices 0.5 mm below the epiphyseal plate), (B) adjusted percentage of bone volume relative to total volume (%BV/TV), (C) adjusted trabecular thickness (Tb.Th), (D) adjusted trabecular number (Tb.N) and (E) adjusted trabecular spacing (Tb.Sp). Two-way ANOVA p values are shown with significant differences in bold. Each mouse is presented as an individual symbol with the lines and error bars representing the means ± SD of the group.

