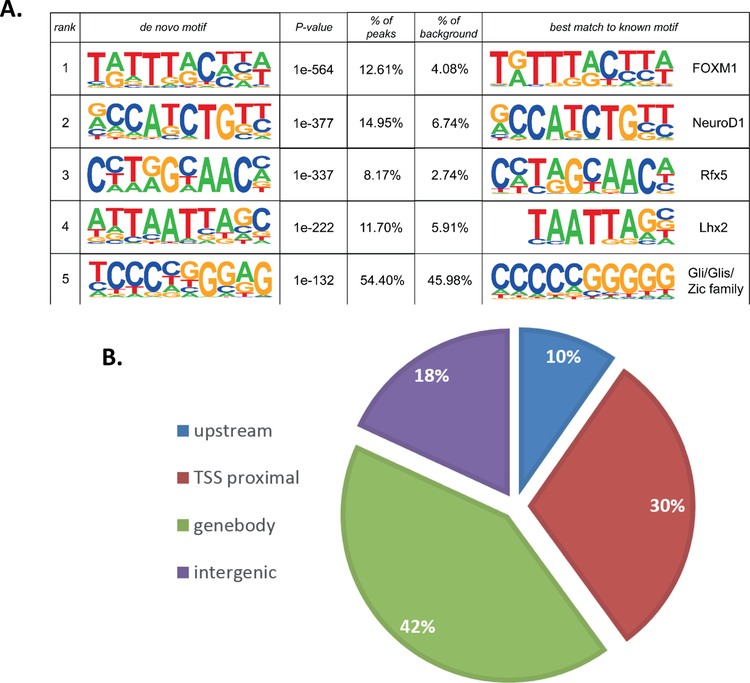
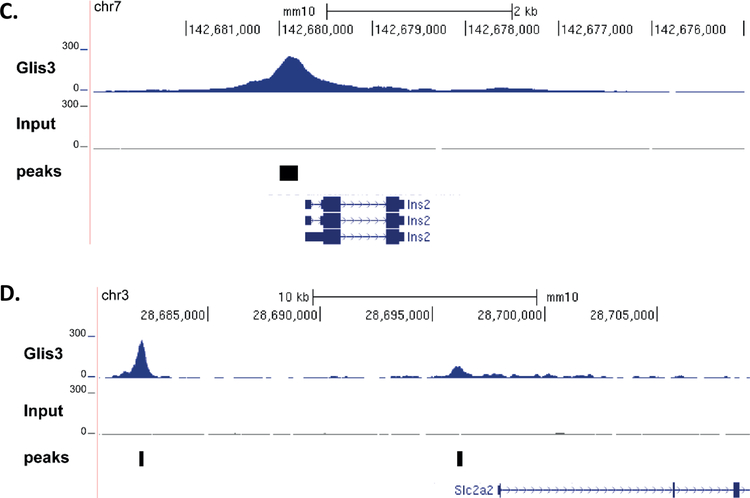
Figure 4. Global GLIS3 binding analysis in mouse islets reveals Slc2a2 direct regulation.
(A) De novo motif analysis was performed on ChIP-seq data using HOMER. (B) Binding analysis of Glis3 ChIP-seq data indicated a preference for introns and promoters. Upstream = −10kb to −1kb relative to TSS, TSS proximal = −1kb to TSS, Gene body = TSS to TES, Intergenic = remaining sequences. (C,D) ChIP-seq binding on the Ins2 promoter, and the Slc2a2 promoter and enhancer. Peaks indicates the peaks called using HOMER.


