Figure 5. GLIS3 binding shows partial overlap with other islet enriched transcription factors.
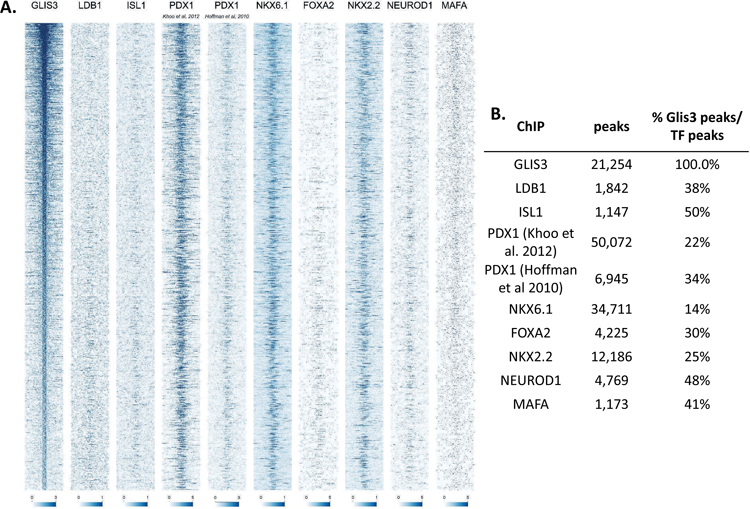
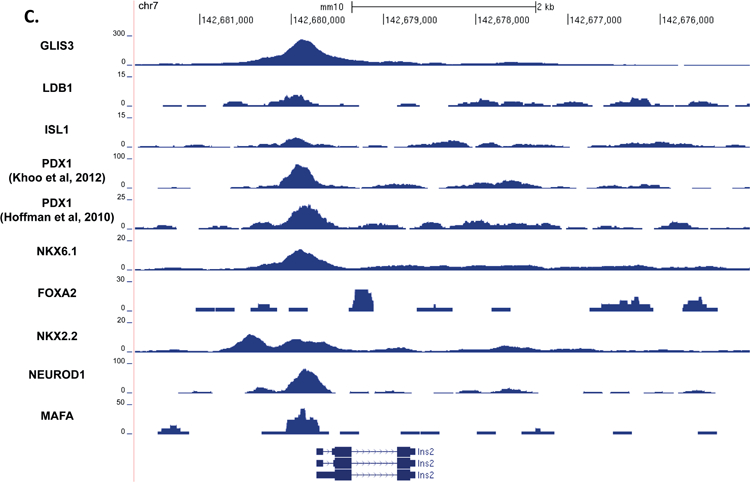
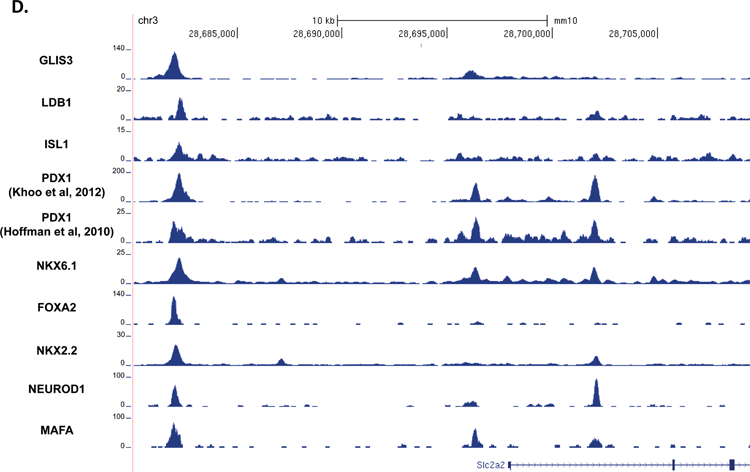
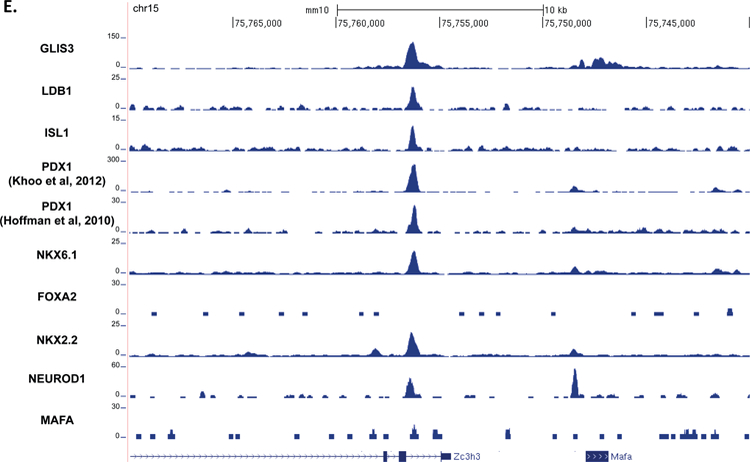
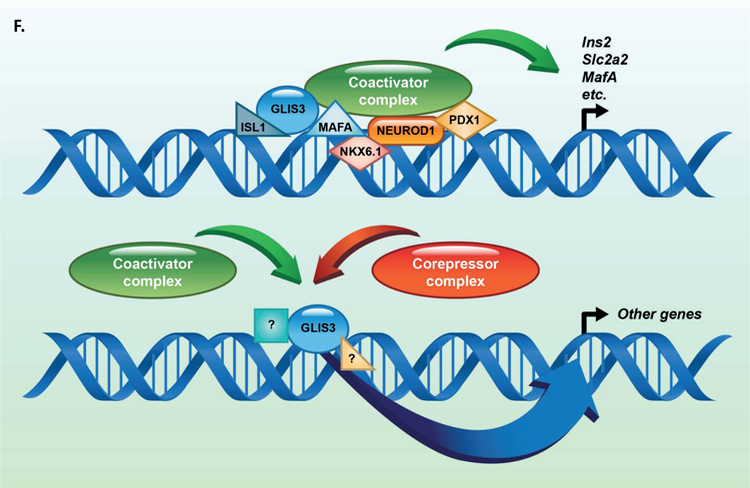
(A) Heatmap of the 2kb region centered on each of the 21,253 GLIS3 binding peaks with ChIP-seq signal normalized to 10 million reads for GLIS3, LDB1, ISL1, PDX1 (from two independent labs), NKX6.1, FOXA2, NKX2.2, NEUROD1, and MAFA. Color intensity indicates read depth, as shown by the scale below each TF panel. (B) Number of peaks called for each ChIP, as well as percentage of TF ChIP peaks colocalizing with GLIS3 peaks with signal above threshold cutoff. ChIP peak colocalization near the Ins2 (C), Slc2a2 (D), and MafA (E) genes. Data displayed via the UCSC genome browser. (F) Model of GLIS3 binding. Glis3 interacts with islet enriched transcription factors on regulatory hubs to control genes related to diabetes, and interacts with other unknown factors to recruit either coactivator or corepressor complexes to control genes related to other processes.
