Figure 1.

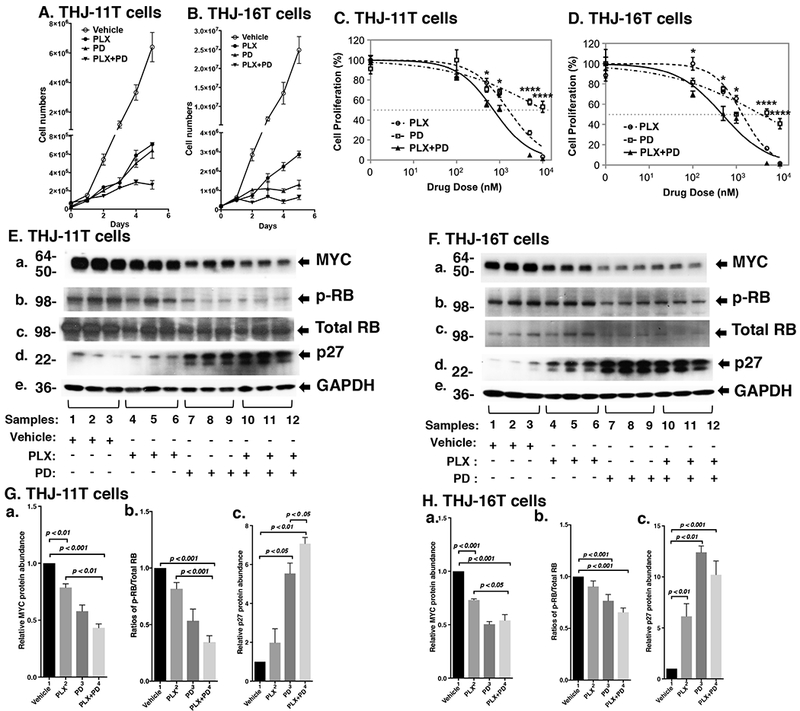
(A and B) The combined treatment of PLX and PD more potently inhibited cell proliferation in the ATC cell lines. Cell proliferation curves for the THJ-11T cells and THJ-16T cells, respectively. (C and D) Cell survival curves showing IC50 values of PLX, PD, and their combination in THJ-11T (C) and THJ-16T (D) cells following 48 hours of treatment. The experiments were performed in triplicate. Significant differences between the effects of the drug combination and its individual components were determined by One-way ANOVA test and were noted by asterisks (P < 0.05 [*] and P < 0.0001 [****]). Data are presented as mean ± SEM. (E and F) Key cell regulators are affected by PLX, PD, and the combined treatment. E and F are images of Western blot analyses for MYC (a), p-RB (b), total RB (c), p27 (d), and GAPDH (e) as loading controls. (G and H) Bar charts show the quantification of the band intensities for the comparisons among vehicle treatment, PLX treatment, PD treatment, and combined treatment with PLX and PD in both cell lines (triplicates for each treatment with three independent experiments). The p values are indicated (n=3).
