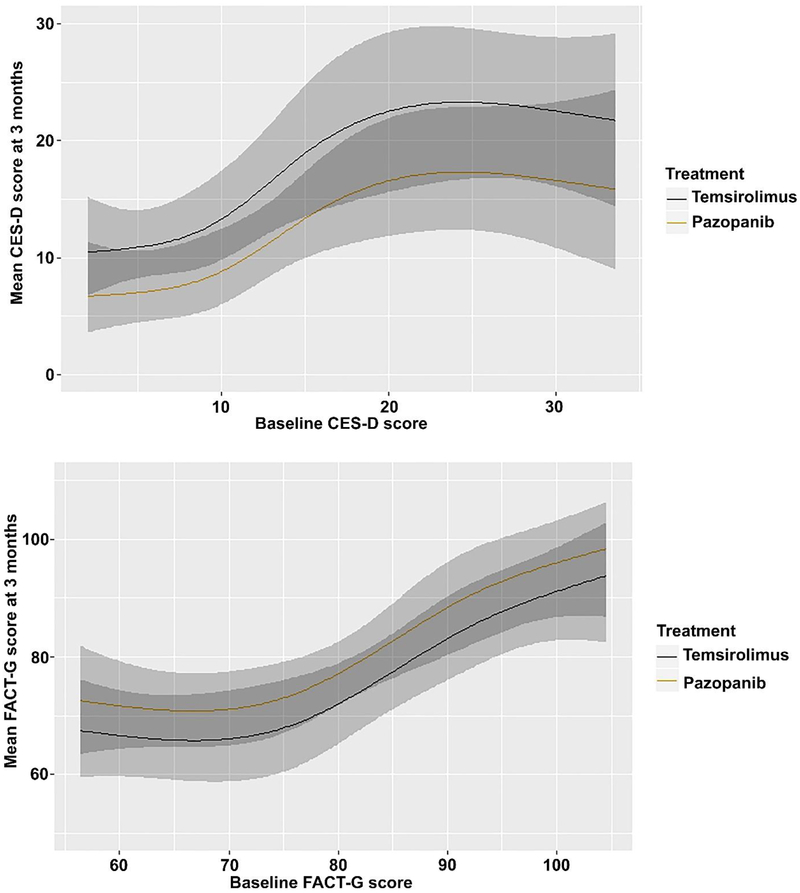
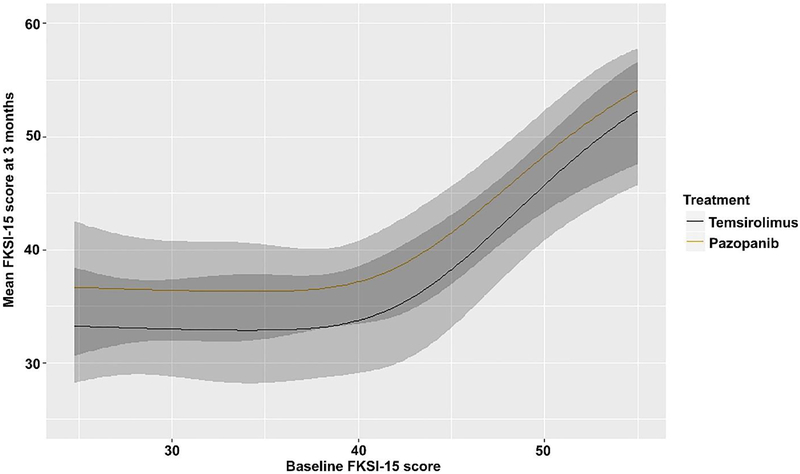
Fig. 3–
Association between baseline and mean patient-reported outcomes at 3 mo by treatment group. The shaded areas represent the 95% confidence bands for each curve, with the darker shade representing the region in which the confidence intervals overlap. CES-D = Center for Epidemiologic Studies—Depression; FACT-G = Functional Assessment of Cancer Therapy— General; FKSI-15 = 15-item Kidney Symptom Index.


