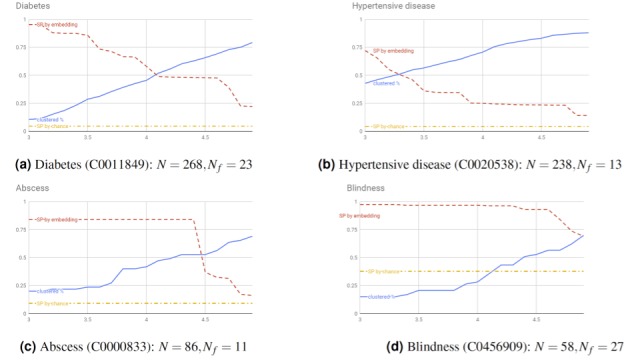
Figure 4.

Clustered percentage versus separate power on difficult cases. The x-axis is the Epsilon (EPS) parameter of the DBScan clustering algorithm---the longest distance between any two items within a cluster; the y-axis is the percentage. Two types of changing information (as functions of EPS) are plotted on each panel: clustered percentage (solid line) and SP on incorrect cases (false-positive mentions of phenotypes). The latter has two series: (1) SP by chance (dash dotted line) when clustering by randomly selecting mentions and (2) SP by clustering using phenotype embedding (dashed line). N: number of all mentions; N_f: number of false-positive mentions; SP: separate power.
