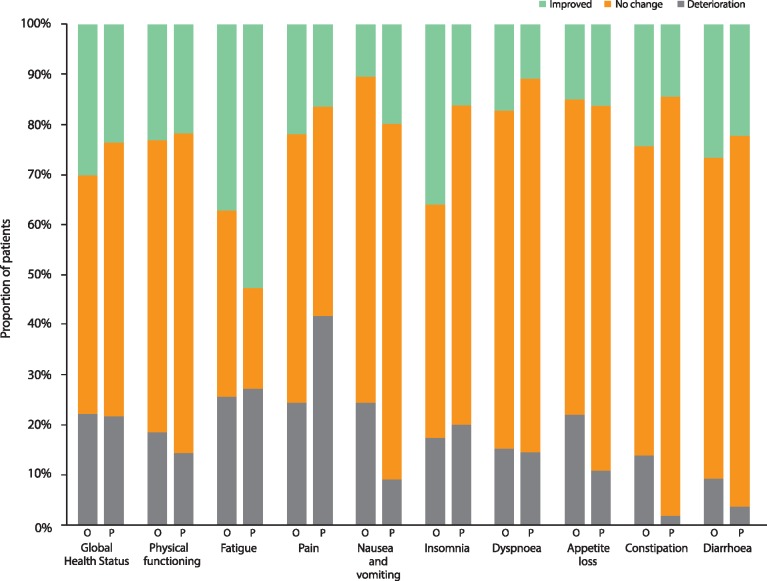
Figure 4.
Best overall quality of life response for EORTC QLQ-C30 Global Health Status, physical functioning and symptom scales. Percentages are calculated based on the 86 olaparib-arm patients and 55 placebo-arm patients (54 for the diarrhoea subscale) with available results. Three patients in each arm (4 placebo arm patients for the diarrhoea subscale) were included in the PRO analysis set, but had no evaluable baseline or post-baseline results and are excluded from this figure. O, olaparib; P, placebo.

