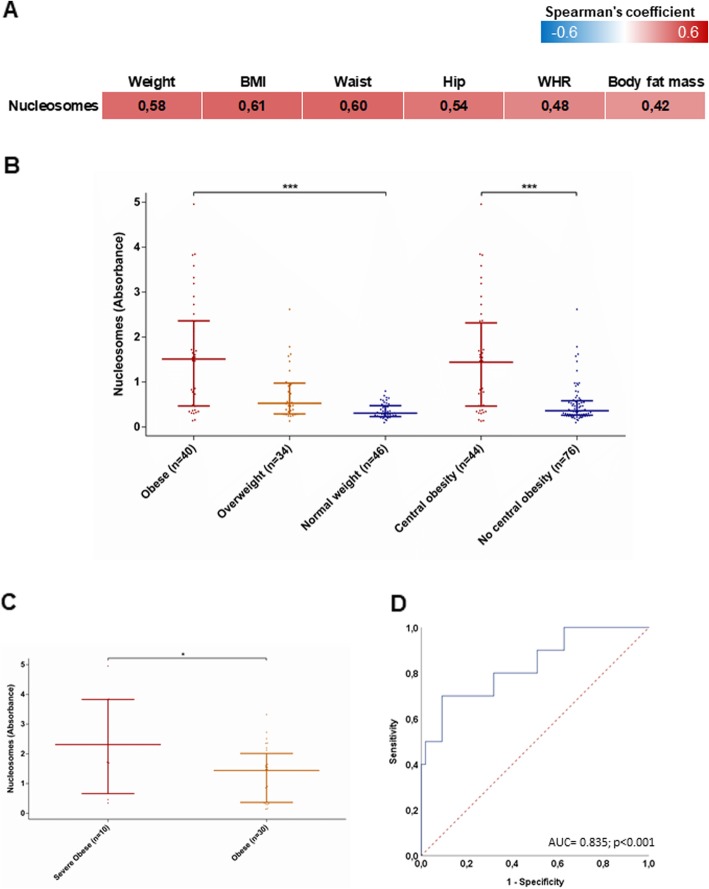
Fig. 1.
Association between circulating nucleosome levels, anthropometric measures and body mass index (BMI) categories. Circulating nucleosomes are assayed by ELISA in Kardiovize participants (n = 120) and expressed as absorbance. a Correlation matrix between circulating nucleosome levels and anthropometric measures. The data are reported as the Spearman’s correlation coefficient and those with a p value < 0.05 are indicated in bold. b, c Comparison of circulating nucleosome levels between BMI categories. The data represent the median and interquartile range and are compared using the Mann-Whitney U or Kruskal–Wallis tests; ***p < 0.001. (D) ROC curve showing the ability of serum circulating nucleosomes to discriminate patients with severe obesity. BMI body mass index, WHR waist to hip ratio

