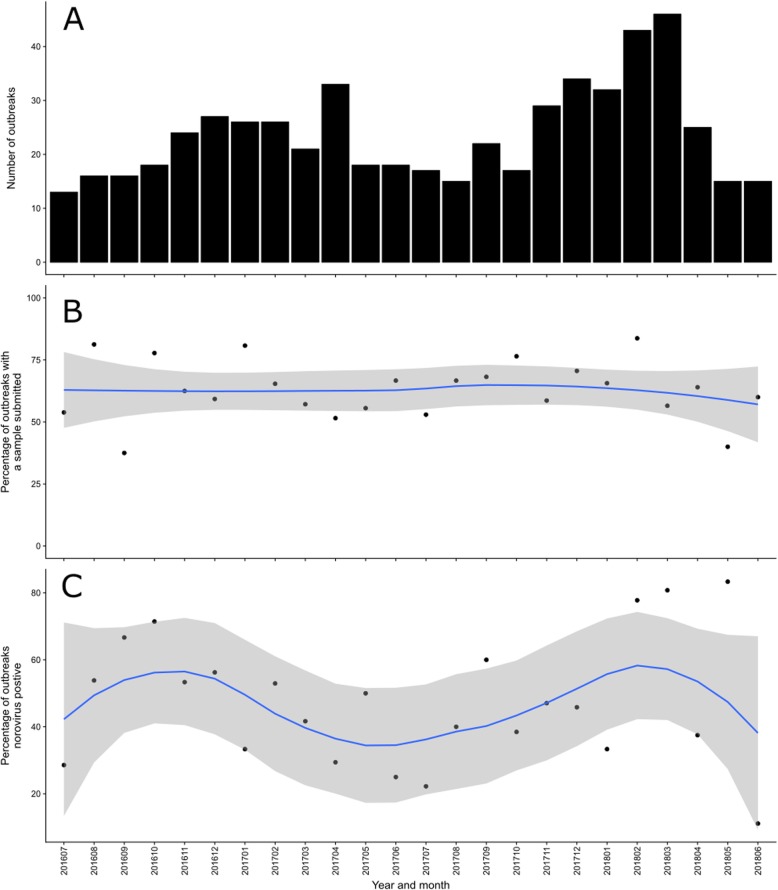
Fig. 1.
Care home gastroenteritis outbreaks by month and year, North East England, 2016–2018. a Total number of outbreaks. b Percentage of outbreaks with a faecal sample submitted, with loess regression smoothed line (blue line) and 95% Confidence Interval (grey). c Percentage of outbreaks with a positive norovirus sample, with loess regression smoothed line (blue line) and 95% Confidence Interval (grey)

