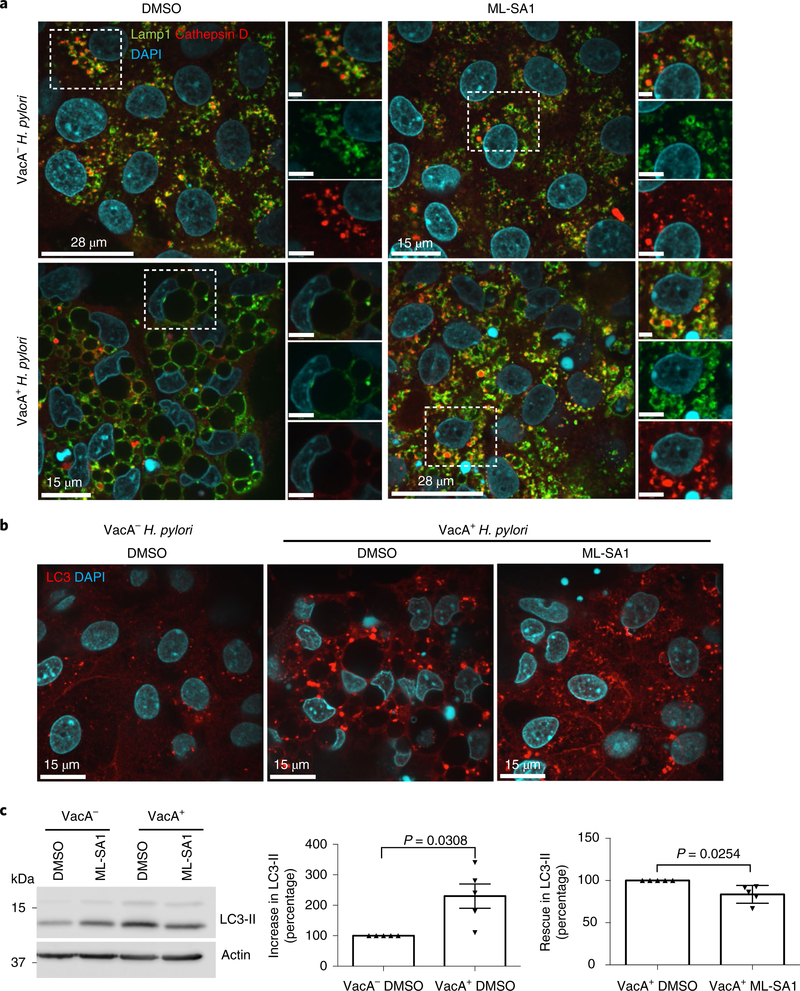
Fig. 5|. Validation of the VacA–TRPML1 axis in human gastric organoids.

a, Lamp1 and cathepsin D staining in gastric organoid monolayers infected overnight with VacA− or VacA+ H. pylori, followed by 4 h ML-SA1 (20 μM) or DMSO (vehicle) administration. A higher magnification of the outlined area is included on the right. b, LC3 staining in organoid monolayers treated as in a. The experiments were independently repeated three times with organoids isolated from different patients. c, LC3 western blotting of 3D gastric organoids treated with VacA− or VacA+ culture supernatant followed by 4 h ML-SA1 (20 μM) or DMSO (vehicle) administration. The graphs show quantification of the increase in LC3-II in organoids treated with VacA+ and the rescue of LC3-II in VacA+-treated organoids incubated with ML-SA1. Actin was used as a loading control. The data were derived from five different patients and represent the mean ± s.e.m. A two-tailed unpaired Student’s t-test was utilized for data analysis.
