Figure 2.
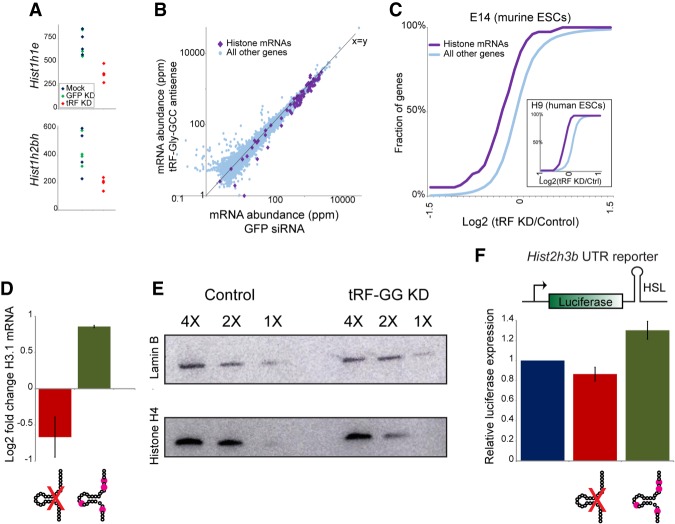
tRF-Gly-GCC represses expression of histone genes via the histone 3′ UTR. (A) mRNA abundance for two example histone genes—Hist1h1e (top) or Hist1h2bh (bottom)—in four replicate RNA-seq libraries from mock-transfected, GFP KD, and tRF-GG KD mES cells, as indicated. (B) Scatter plot comparing RNA abundance for histone genes (purple diamonds) and all other genes in GFP KD ES cells (X-axis) and tRF-GG-inhibited ES cells (Y-axis). Note that nearly all histone genes fall below the X = Y diagonal. (C) Cumulative distribution of the effects of tRF-GG inhibition on histone mRNA expression, with the Y-axis showing cumulative fraction of genes exhibiting any given log2 fold change in expression (X-axis). Main panel shows data from murine ES cells (n = 4 replicates, KS P = 7.7 × 10⁻⁵), while inset shows data for human ESCs. See also Supplemental Figure S2. (D) qRT-PCR for Hist2h3b showing effects of transfecting the anti-tRF-GG LNA, or a synthetic tRF-GG oligonucleotide (bearing most of the modified nucleotides expected from human tRNA-Gly-GCC) (Materials and Methods). (E) tRF-GG inhibition leads to decreased histone protein levels. Western blots probed for Histone H4 or loading control Lamin B, as indicated. See also Supplemental Figure S2D,E. (F) tRF-GG regulates histone 3′ UTR-mediated reporter expression. We generated stable ES cell lines carrying a luciferase reporter bearing the 3′ UTR of Hist2h3b (Supplemental Fig. S4A shows data for an independent cell line bearing the Hist1h4j 3′ UTR). Bar graph shows average changes to reporter activity in response to control KD, tRF-GG LNA (14% decrease, P = 0.038), or the modified tRF-GG oligo (30% increase, P = 0.0002).

