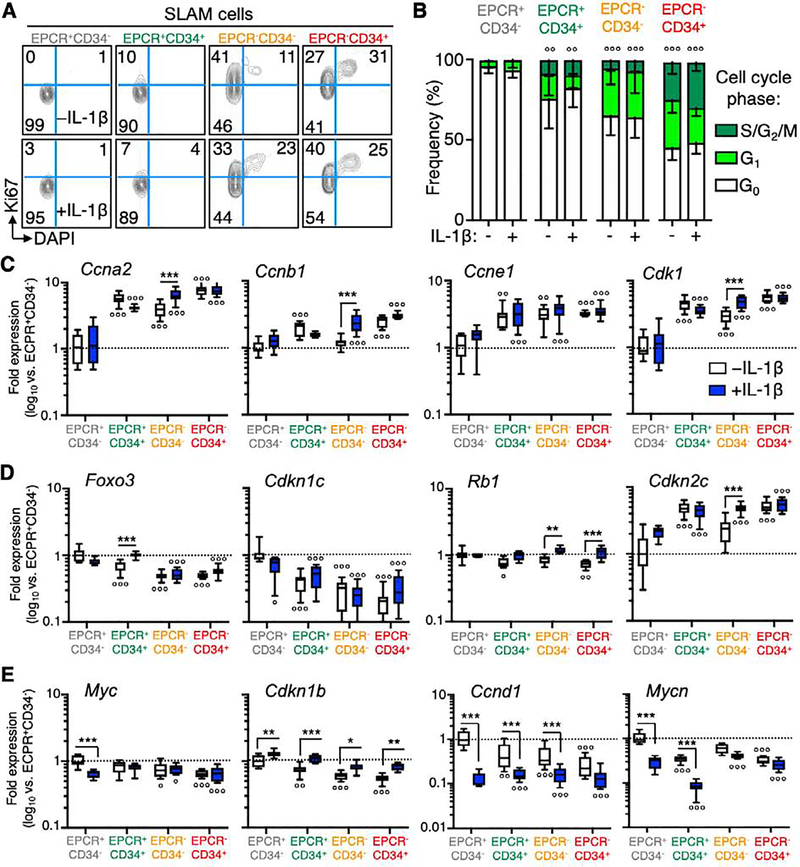
Figure 3. EPCR+/CD34− SLAM cells are highly quiescent.
(A) Representative FACS plots and (B) quantification of cell cycle distribution in SLAM cells fractionated by EPCR and CD34 expression, from mice treated ± IL-1 for 20d (n = 5/grp). (C-E) Expression of cell cycle activator and inhibitor genes in SLAM cells fractionated by EPCR and CD34 expression from mice treated ± IL-1 for 20d (n = 7–8/grp). Data in (C-E) are expressed as log10 fold expression vs. -IL-1 EPCR+/CD34− SLAM cells. ○ p < 0.05, ○○ p < 0.01, ○○○ p < 0.001 vs. -IL-1 EPCR+/CD34− SLAM cells; * p < 0.05, ** p < 0.01, *** p < 0.001 vs. -IL-1 condition within each fraction, as determined by two-way ANOVA. Data are representative of two independent experiments.

