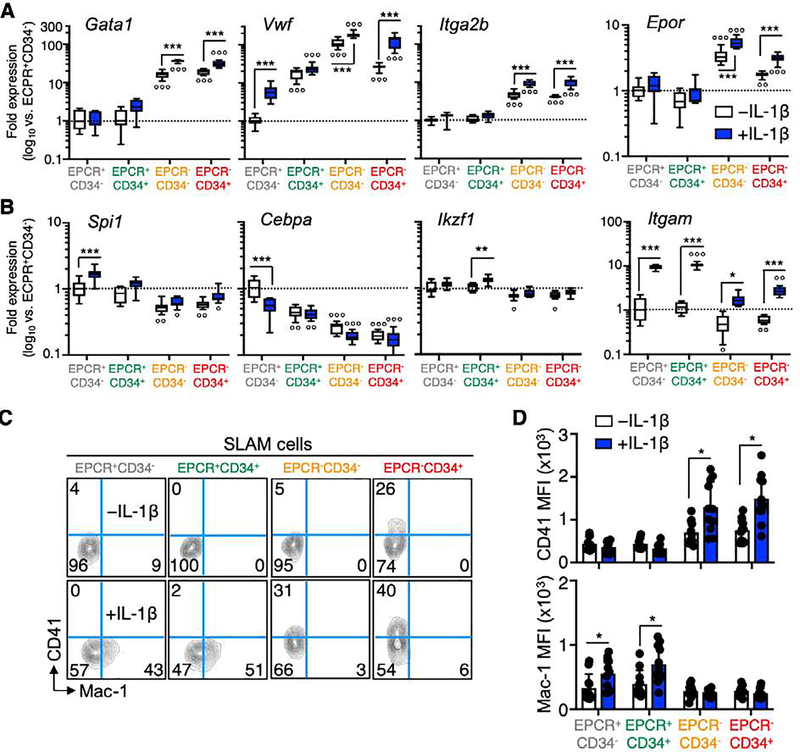
Figure 4. EPCR expression distinguishes Mk/E-primed SLAM cells.
(A-B) Expression of (A) Mk/E and (B) myeloid/lymphoid lineage genes in SLAM cells fractionated by EPCR and CD34 expression, from mice treated ± IL-1 for 20d (n = 7–8/grp). Data in (A-B) are expressed as log10 fold expression vs. -IL-1 EPCR+/CD34− SLAM cells. (C) Representative FACS plots and (D) geometric mean fluorescence intensity (MFI) quantification of CD41 and Mac-1 expression in cells fractionated by EPCR and CD34 expression, from mice treated ± IL-1 for 20d (n = 10–11/grp). ○ p < 0.05, ○○ p < 0.01, ○○○ p < 0.001 vs. -IL-1 EPCR+/CD34− SLAM cells; * p < 0.05, ** p < 0.01, *** p < 0.001 vs. -IL-1 condition within each fraction, as determined by two-way ANOVA. Data are representative of two independent experiments.

