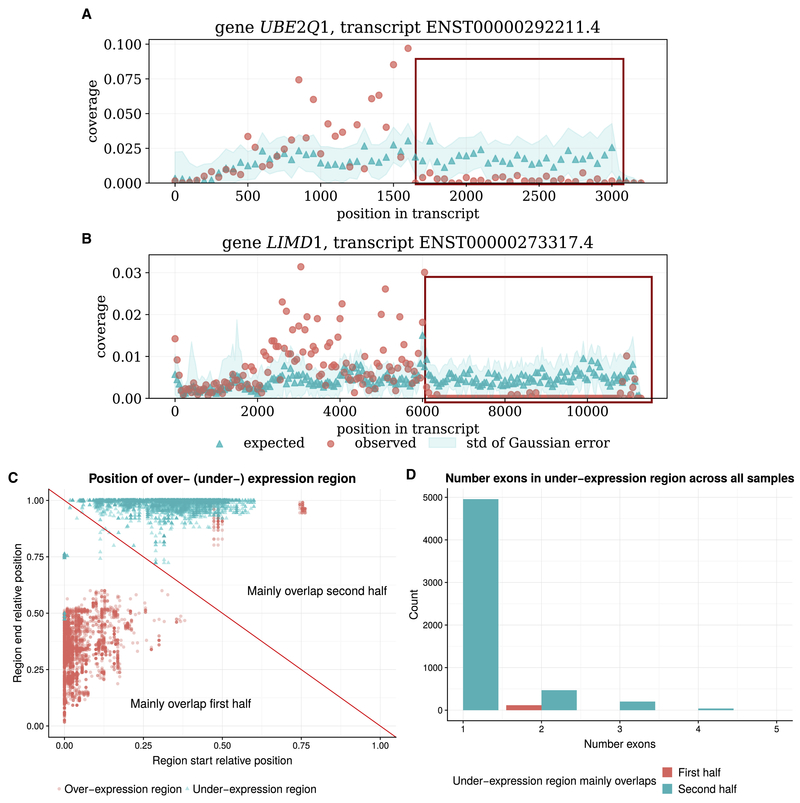
Figure 2: Examples and characteristics of unadjustable anomalies.
(A) An example of unadjustable anomaly of gene UBE2Q1 (B) An example of unadjustable anomaly of gene LIMD1. Both examples are found in the heart sample of the Human Body Map dataset. Red and blue points are the observed and expected coverage distribution of the anomaly transcripts, and the blue shade is the standard deviation of the expected distribution estimation. The red box indicates the under-expression anomaly region. For both genes, the transcript region near the 5′ end is over-expressed, and the region near the 3′ end is under-expressed. (C) The start and end proportion of the over-expressed and under-expressed region of common anomalous transcripts. The red diagonal line separates between anomalies of which the over- (under-) expression regions mainly overlaps with the first half (5′ half), and the second half (3′ half) of the transcripts. For most of the anomalies, the over-expressed region mainly overlaps with the first half of the anomalous transcript, and the under-expressed region mainly overlap with the second half of the anomalous transcript. (D) Histogram of the number of exons spanning the under-expressed region of the common anomalies. Y-axis is the count summed over all 46 samples. The under-expressed region usually only contain one or a partial exon.

