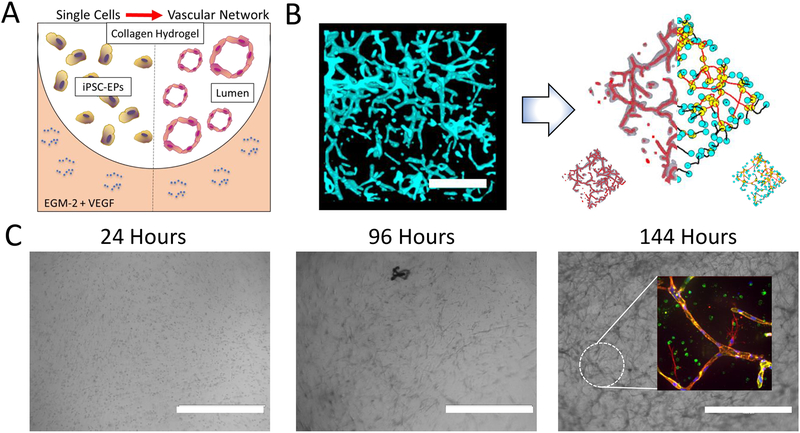
Figure 2: Generation and Analysis of iPSC-EP Vascular Networks in Collagen Hydrogels.
A. A cross-section of the 3D microenvironment used in this assay to promote vascular network formation from iPSC-EPs. A floating collagen hydrogel is seeded with iPSC-EPs and exposed to EGM-2 supplemented with 50 ng/mL VEGF and a temporal dose of Y-27632. B. The resulting capillary plexus is highly branched and interconnected, as visualized via staining with F-actin (cyan). The binarized image, shown on the left, is generated by pre-processing with ImageJ. This z-stack is then analyzed via a previously developed algorithm, which skeletonizes the network (shown in a collection of thin red lines) and then analyzes the network topology for branches (yellow), end points (blue), isolated vessels (black), and connected vessels (red). The scale bar represents a length of 100 μm C. Morphological changes of iPSC-EPs-laden collagen hydrogels: 24 hours after seeding, the iPSC-EPs remain spherical and within 96 hours gradually take on a more elongated phenotype. Further culture results in assembly of lumen-containing VE-Cadherin network, as shown in the inset at the 144-hour time point. The scale bars represent lengths of 400 μm; green = VE-Cadherin, red = F-actin, and blue = DAPI.

