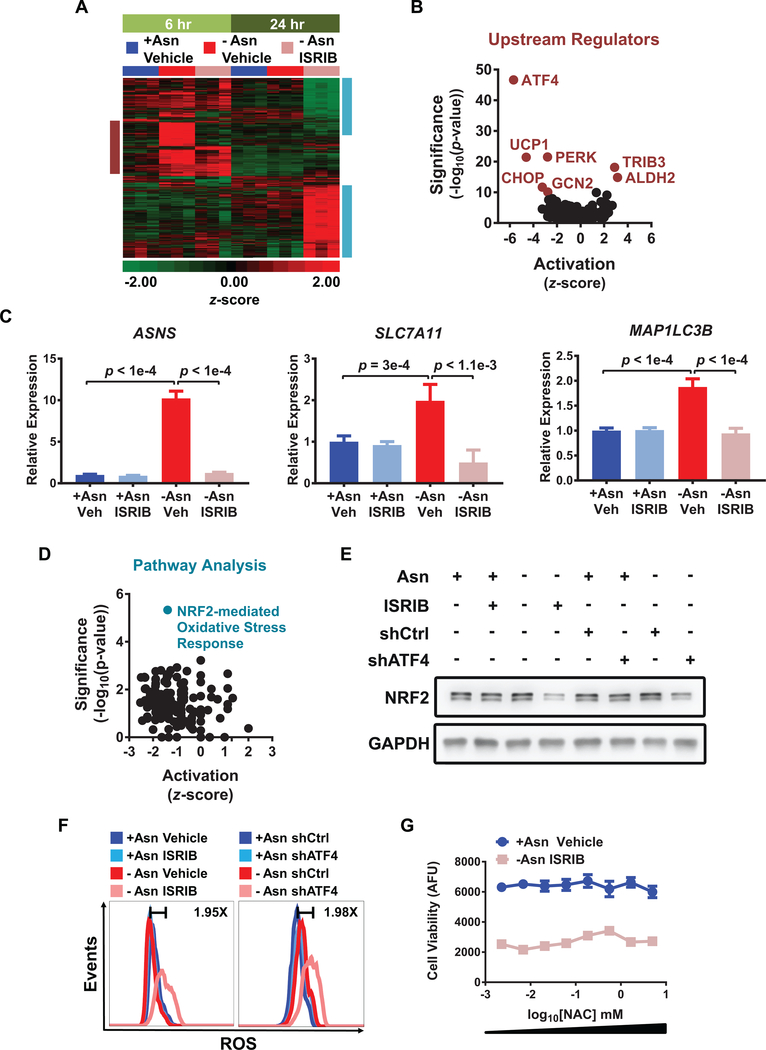
Figure 3. Molecular effects of ATF4 inhibition and ISRIB during asparagine starvation.
A) RNAseq of PC9 cells treated as indicated for either 6 hr (light green) or 24 hr (dark green). The heat map depicts the z-scores for genes that were significantly changed (FDR < 0.05 and fold change < −1.5 or > 1.5) in any treatment comparisons (6 hr or 24 hr). The burgundy box highlights acute changes activated by the ISR at 6 hr, while the aqua box highlights changes associated with chronic asparagine starvation at 24 hr. Scale narrowed to −2 to +2 for increased contrast. B) Volcano plot of IPA upstream regulators analysis for -Asn ISRIB versus -Asn Vehicle at 6 hr. C) qRT-PCR of representative ATF4 targets in PC9 cells treated as indicated for 6 hr; veh = vehicle. Relative expression normalized to GUSB with upper and lower limits shown as representative experiment. D) Volcano plot of pathway analysis for -Asn ISRIB versus +Asn Vehicle at 24 hr. E) Western blotting for NRF2 and GAPDH (loading control) in PC9 cells treated as indicated. F) Flow cytometry analysis of ROS generation using CellROX probe in PC9 cells treated as indicated for 48 hr. Fold changes between controls (dark blue) and dual treatments (light pink) are indicated. Representative experiment depicted; n = 2. G) Cell viability of cells treated as indicated for 6 days with the addition of increasing concentrations of NAC. AFU is arbitrary fluorescence units. Error bars show SEM; n = 2. Unless otherwise noted, n = 3 and p-values by Unpaired t-test.

