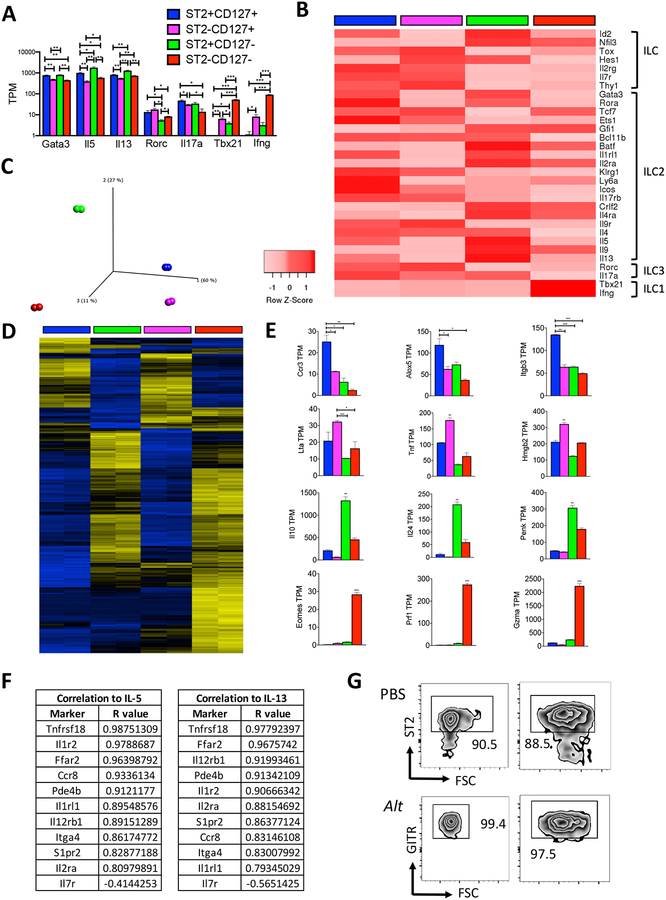
Figure 2. ILC subpopulations contain ILC2 as well as heterogenous ILC transcriptomes.
RNA sequencing-derived transcript levels (A) and heat map (B) of ILC1, ILC2, ILC3 transcripts following Alternaria challenge (B). PCA plot (C), heat map (D), and differentially expressed candidate genes (E) following Alternaria challenge. Transcript correlation with IL-5 and IL-13 (F). (G) % ST2 and GITR of IL-5+ Thy1.2+ ILCs from Fig 1I. (A-F) Data shown are representative of a single experiment with two replicates that include pooled lungs from 9 mice. (G) Representative of 3 mice per group. *p < 0.05, **p < 0.01, ***p < 0.001, unpaired t test. Unless indicated by bars, stats in (E) compared to all other groups.

