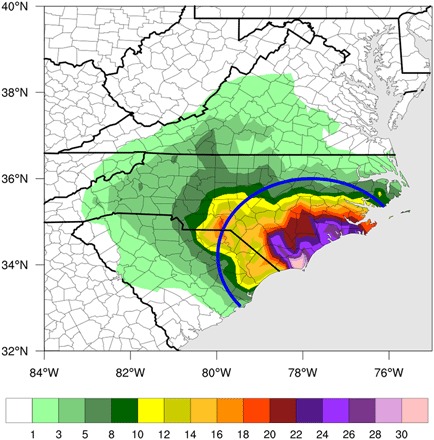
Fig. 2. Observed Florence rainfall.

Total observed accumulated precipitation (inches) within 500 km of Hurricane Florence’s landfall location. NWS observations are regridded onto the CAM5 grid. Blue line represents 200 km around the location of landfall used for rainfall analysis.
