
Fig. 3. Simulated changes in storm rainfall.
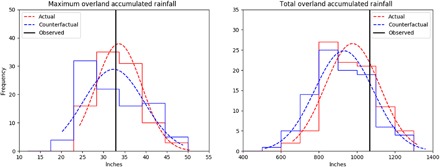
Histograms of the (left) maximum accumulated rainfall amounts and (right) total accumulated rainfall within 200 km and 48 hours of the model landfall for the Actual (red) and Counterfactual (blue) 11 September 00Z ensembles. Dashed lines are Gaussian fits to the data. Only the 96 ensemble members that make landfall within 200 km of the observed landfall location are included. The NWS observations are marked with vertical black lines.