
Fig. 2. CHK2 interacts with FOXK in vivo and in vitro, and CHK2 regulates DNA damage–induced autophagy though FOXK.
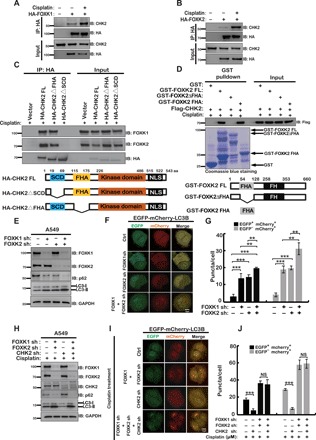
(A and B) Human embryonic kidney (HEK) 293T cells transfected with HA-FOXK1 (A) or HA-FOXK2 (B) were treated vehicle or 20-μM cisplatin for 24 hours and purified using anti–HA-agarose beads. The immunoprecipitates were then blotted with the indicated antibodies. (C) HEK293T cells transfected with HA-tagged WT CHK2 (FL), FHA deletion mutant of CHK2 (ΔFHA), or SCD deletion mutant of CHK2 (ΔSCD) and treated with 20 μM cisplatin before harvest were lysed, and then cell lysates were subjected to immunoprecipitation with anti–HA-agarose beads. The immunoprecipitates were then blotted with the indicated antibodies. The schema below depicts the various constructs of CHK2 used in this experiment. (D) HEK293T cells were transfected with Flag-CHK2 and treated with 20-μM cisplatin before harvest, and then cell lysates were incubated with Sepharose coupled with GST, GST-FOXK2, GST-FOXK2△FHA, or GST-FOXK2 FHA. After washing, proteins bound to Sepharose were blotted with indicated antibodies. The schema below depicts the various constructs of FOXK2 used in this experiment. (E) A549 cells stably expressing the indicated FOXK constructs were lysed. Western blot was performed with the indicated antibodies. (F) EGFP-mCherry-LC3B and the indicated constructs were stably expressed in HEPG2 cells. Green (EGFP) and red (mCherry) fluorescence were analyzed by confocal microscopy (40×). Representative images are shown. Scale bar, 10 μm. (G) Quantification of the data in (F). **P < 0.01 and ***P < 0.001. Statistical analyses were performed using Student’s t test. NS stands for no significant change. (H) A549 cells stably expressing the indicated constructs were treated with cisplatin for 24 hours. Western blot was performed with the indicated antibodies. (I) EGFP-mCherry-LC3B and the indicated constructs were stably expressed in HEPG2 cells. Cells were treated with cisplatin for 24 hours. Green and red fluorescence were analyzed by confocal microscopy (40×). Representative images are shown. Scale bar, 10 μm. (J) Quantification of the data in (I). ***P < 0.001. Statistical analyses were performed using Student’s t test.