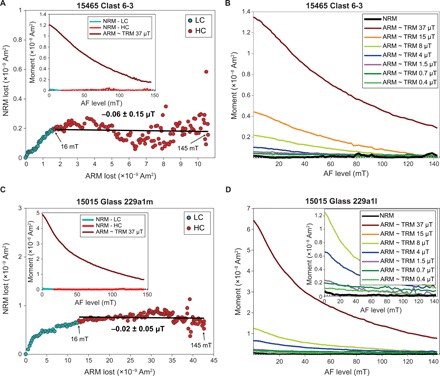
Fig. 2. Paleointensity estimates for subsamples of breccias 15465 and 15015.

(A and C) ARM paleointensity experiments on 15465 subsample 6-3 and 15015 subsample 229a1m, respectively. Paleointensities are estimated from NRM lost during AF demagnetization as a function of ARM gained in a 50-μT DC bias field and a 260-mT AF. AF steps used to calculate the LC and HC paleointensities are colored blue and red, respectively. Paleointensities and their uncertainties (95% confidence intervals) are shown for the HC range. Insets in (A) and (C) show the decay of NRM and ARM during progressive AF demagnetization. (B and D) ARM paleointensity fidelity tests on 15465 subsample 6-3 and 15015 subsample 229a1l, respectively. Legends list TRM-equivalent fields for ARMs acquired in a range of DC bias fields in an AF of 260 mT and assuming ARM/TRM = 1.34 (section S4) (49). Horizontal dashed lines indicate the noise level due to acquisition of spurious ARM during AF demagnetization. Inset in (D) shows a magnified view of the moment decay.
