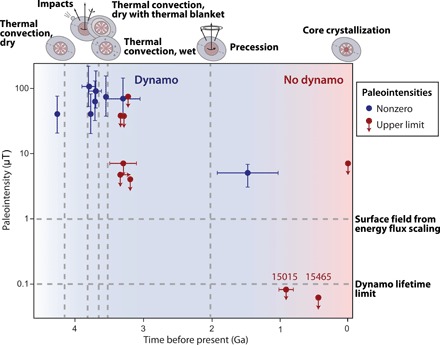
Fig. 4. Paleointensities for breccias 15465 and 15015 and those of other modern measurements of lunar rocks.

Points labeled 15015 and 15465 are new paleointensity estimates reported by this study, while the remaining points are previously measured values (6, 9). Red points denote upper limits on the field (i.e., values indistinguishable from zero), while blue points denote nonzero values (i.e., detections of the paleofield). Vertical and horizontal arrows and error bars indicate the paleointensity and age limits and 1-SD uncertainties, respectively. The blue and red shaded regions indicate the epochs when the dynamo is inferred to be active and have ceased, respectively. Vertical and horizontal arrows and error bars indicate the paleointensity and age limits and uncertainties, respectively. The vertical dashed lines are the lifetime for proposed dynamo mechanisms: thermal convection in a dry mantle (11), impact-driven changes in mantle rotation (50), thermal convection in a dry mantle covered by a thermal blanket (12), thermal convection in a wet mantle (13), lunar precession (16), and core crystallization (15). The upper and lower horizontal dashed lines denote the maximum field predicted by energy flux scaling (36) and the predicted field exceeded by all published dynamo models for >90% of the dynamo lifetime, respectively. Data are tabulated in table S22.
