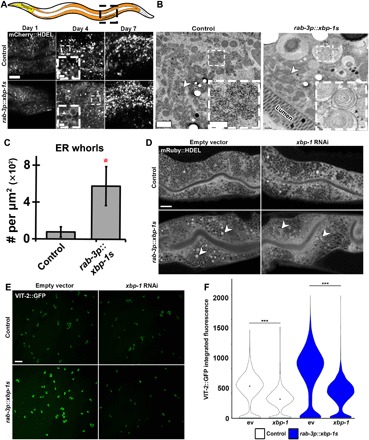
Fig. 1. Neuronal xbp-1s promotes ER remodeling and increased ER function in peripheral tissue.

(A) Representative confocal micrographs of ER morphology (via an intestine-specific vha-6p::mCherry::HDEL using a sel-1 signal sequence) at various times in adulthood (“young,” day 1; “middle-aged,” day 4; “old,” day 7) under control and “neuronal xbp-1s” (rab-3p::xbp-1s) conditions. In the cartoon, the intestine is shown in orange, and the pharynx is shown in yellow. Arrowhead indicates representative ER remodeling. Scale bars, 10 μm. (B) Electron micrographs of intestine from control and neuronal xbp-1s–overexpressing animals (rab-3p::xbp-1s) at late day 2 of adulthood. Arrowheads mark rough ER. Scale bars, 1 μm (0.25 μm for inset). (C) Quantification of ER whorls per square micrometer in control versus rab-3p::xbp-1s animals. *P ≤ 0.05, using t test. Plots are representative of three biological replicates and analyzed from 10 to 30 images per sample. (D) Representative confocal micrographs of ER morphology using an alternative labeling method (vha-6p::mRuby::HDEL using an hsp-4 signal sequence). Animals were grown on either empty vector (ev) or xbp-1 RNA interference (RNAi) from hatch and imaged at late day 2. Arrowheads indicate representative ER remodeling. Scale bar, 10 μm. (E) Representative images of eggs expressing VIT-2::GFP. Transgenic control or rab-3p::xbp-1s animals carrying VIT-2::GFP were grown on either empty vector or xbp-1 RNAi from hatch until day 1 adulthood and then bleached, and eggs were imaged. Scale bar, 100 μm. (F) Quantification of data from (E) where control animals are represented as white and neuronal xbp-1s animals are blue. Plots are representative of three biological replicates and n > 2000 eggs per condition. ***P < 0.001, using nonparametic Mann-Whitney test.
