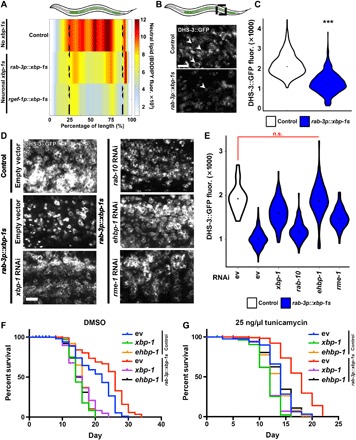
Fig. 2. ER remodeling in neuronal xbp-1s animals is concomitant with lipid depletion.

(A) Median profiles of nematode neutral lipid distribution (via BODIPY 409/503 stain) of control animals and neuronal xbp-1s animals using two different neuron-specific promoters (rab-3p and rgef-1p) following alignment. Data are shown as a heat map with red as the highest amount of lipid and white as the lowest. All animals are positioned with the anterior side to the left. (B) Representative confocal micrographs of intestinal lipid droplets (LDs) (via dhs-3p::DHS-3::GFP) in day 2 adult control and neuronal xbp-1s animals. Scale bar, 5 μm. Arrowheads indicate representative LDs. (C) Quantification of LDs (via DHS-3::GFP fluorescence) in day 2 adults in control (white) and neuronal xbp-1s (blue) animals. ***P < 0.001, using nonparametric Mann–Whitney test, against age-matched control. Plots are representative of three biological replicates and n = 460 (control) and 754 (rab-3p::xbp-1s). (D) Representative confocal micrographs of LDs (DHS-3::GFP) from staged, day 2 adults. Animals were grown on RNAi from hatch. Scale bar, 5 μm. (E) Quantification of LDs (via DHS-3::GFP fluorescence) from (D). n.s., P > 0.10 using nonparametric Mann-Whitney test. Plots are representative of three biological replicates and n = 136 to 185 organisms per strain. Direct comparisons to xbp-1 and ehbp-1 knockdown in wild-type animals are available in fig. S4. (F and G) Life spans of nematodes under control [dimethyl sulfoxide (DMSO) (F)] and under ER stress [tunicamycin (25 ng/μl) (G)]. Animals were grown from hatch on ev, xbp-1, or ehbp-1 RNAi and moved onto either 1% DMSO or tunicamycin (25 ng/μl) plates at day 1. Life spans of (F) and (G) were performed simultaneously and separated for ease of visibility. Data are representative of three independent trials. See table S1 for life-span statistics.
