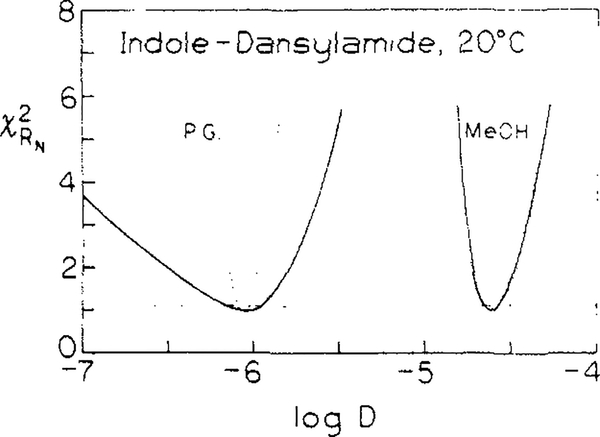
Figure 4.
Dependence of χR2 on the diffusion coefficients recovered from Gosele et al. model. The dashed line indicate the highest values of χR2 consistent with random noise in 67% of repetitive measurements. The dotted lines show χR2 dependence on the diffusion coefficients if R0 are kept constant in analysis.

