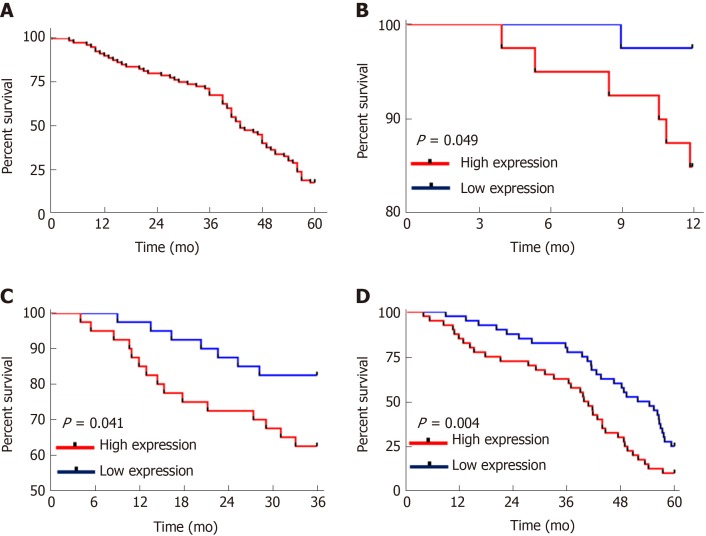
Figure 3.
Relationship between cancer susceptibility candidate 9 and patients’ survival. A: The overall survival of patients; B: The 1-year survival of patients in the high and low Cancer susceptibility candidate 9 (CASC9) expression groups (P = 0.049); C: The 3-year survival of patients in the high and low CASC9 expression groups (P = 0.041); D: The 5-year survival of patients in the high and low CASC9 expression groups (P = 0.004). CASC9: Cancer susceptibility candidate 9.

