
Figure 1.
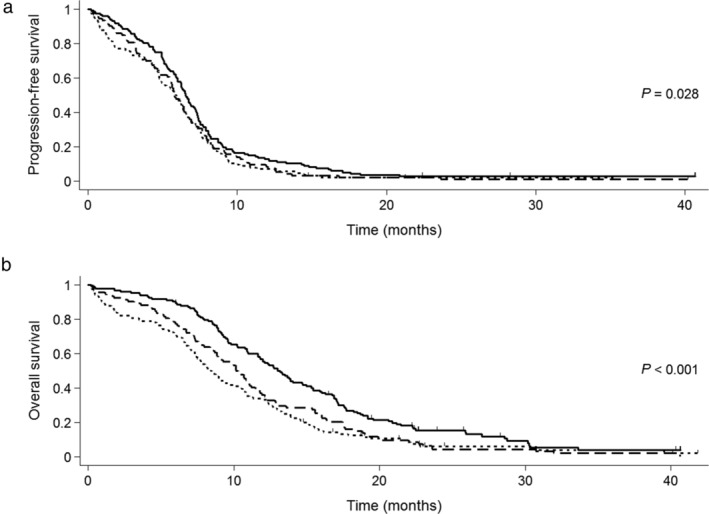
Kaplan‐Meier curves for (a) progression‐free survival and (b) overall survival according to GNRI. GNRI, Geriatric Nutritional Risk Index. ( ) GNRI > 98 (n = 133), (
 ) GNRI 92–98 (n = 95) and (
 ) GNRI < 92 (n = 124).
Official websites use .gov
A
.gov website belongs to an official
government organization in the United States.
Secure .gov websites use HTTPS
A lock (
) or https:// means you've safely
connected to the .gov website. Share sensitive
information only on official, secure websites.
Kaplan‐Meier curves for (a) progression‐free survival and (b) overall survival according to GNRI. GNRI, Geriatric Nutritional Risk Index. () GNRI > 98 (n = 133), () GNRI 92–98 (n = 95) and () GNRI < 92 (n = 124).