
Figure 2.
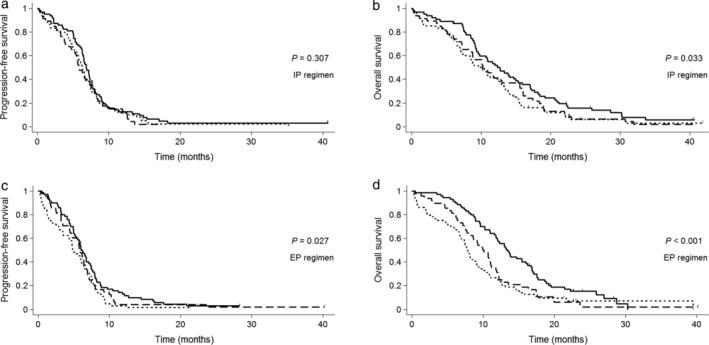
Kaplan‐Meier curves for (a) progression‐free survival, (b) overall survival in the IP arm, and (c) progression‐free survival and (d) overall survival in the EP arm according to GNRI. EP, etoposide/cisplatin; GNRI, Geriatric Nutritional Risk Index; IP, irinotecan/cisplatin. (a, b) ( ) GNRI > 98 (n = 63), (
 ) GNRI 92–98 (n = 47) and (
 ) GNRI < 92 (n = 60). (c, d) () GNRI > 98 (n = 70), () GNRI 92–98 (n = 48) and () GNRI < 92 (n = 64).