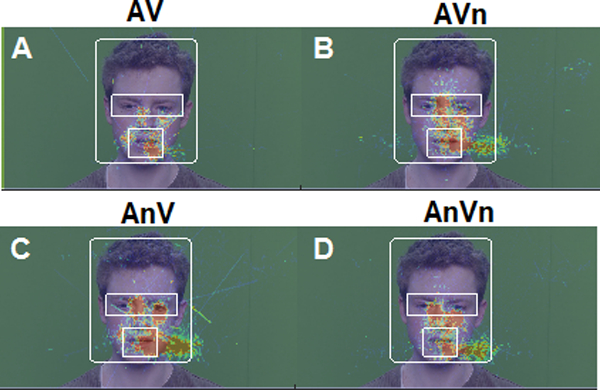
Figure 3: Spatial distribution of eye gaze on the talker’s face as a function of audiovisual noise.

Hotter colors = more frequent fixations. Shown here are eye data from a representative subject overlaid onto a single frame of the male talker video. Fixations for (A) clean (B) visual noise, (C) auditory noise, (D) auditory and visual noise conditions. Boxes demarcate analysis ROIs (eyes, mouth) within the space of the talker’s head. In more difficult conditions, listeners shift their gaze way from the mouth to the eyes of the speaker (cf. A vs. D).
