
Figure 4.
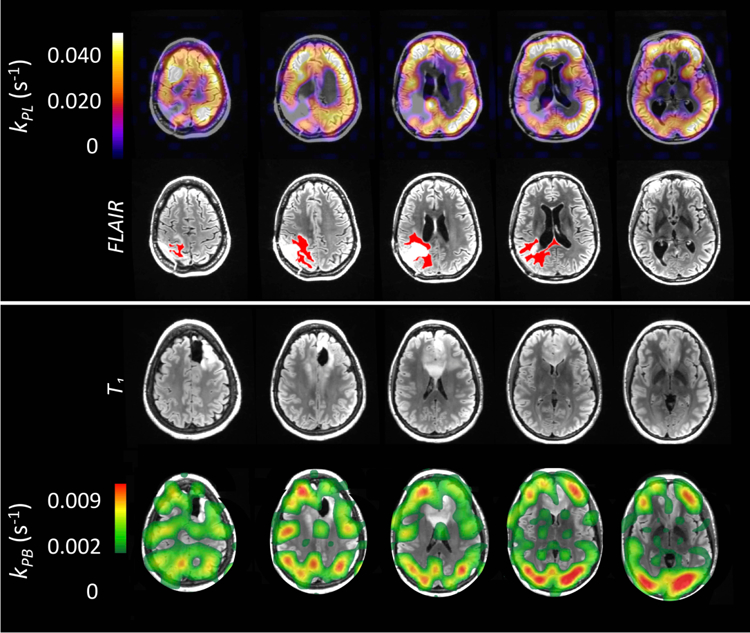
[Top] Examples of kPL maps superimposed to FLAIR images of a patient (data set 14) affected with glioma (active tumor highlighted in red) [Bottom] Examples of kPB maps superimposed to T1-weighted images of a patient (data set 16). Sinc interpolation and the error criterion (σkPL < 0.6∙kPL) were used to generate kinetic maps in both cases (see text for detail).