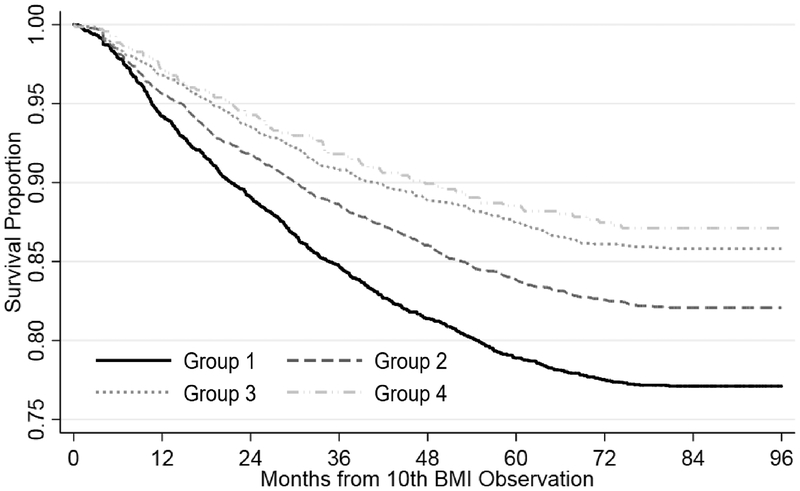
Figure 2. Kaplan Meier curve displaying attrition stratified by BMI trajectory group, Themba Lethu Clinic, Johannesburg, South Africa (N=11,263).
As patients were not eligible unless they had at least 10 BMI measurements, person-time was calculated from the individual’s 10th BMI observation to either: 1) attrition (death and loss to follow-up), 2) transfer, or 3) close of the dataset (December 2015), whichever occurred first.

