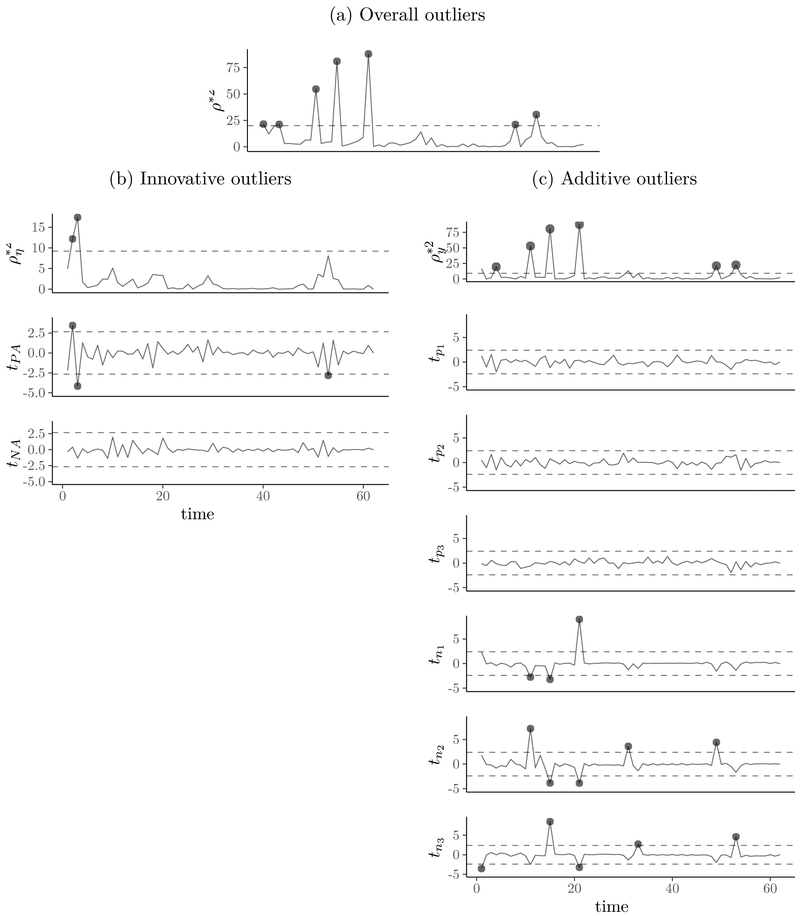
Figure 6.
Chi–square and t Statistics Associated with Outliers to the State and Measurement Components. The First Graph is for the Joint Chi–square Statistic, the Second Graph is for the Independent Chi–square Statistic, and the Other Graphs are for t Statistic. The Dashed Lines Indicate the Critical Values of Chi–square and t Statistics.

