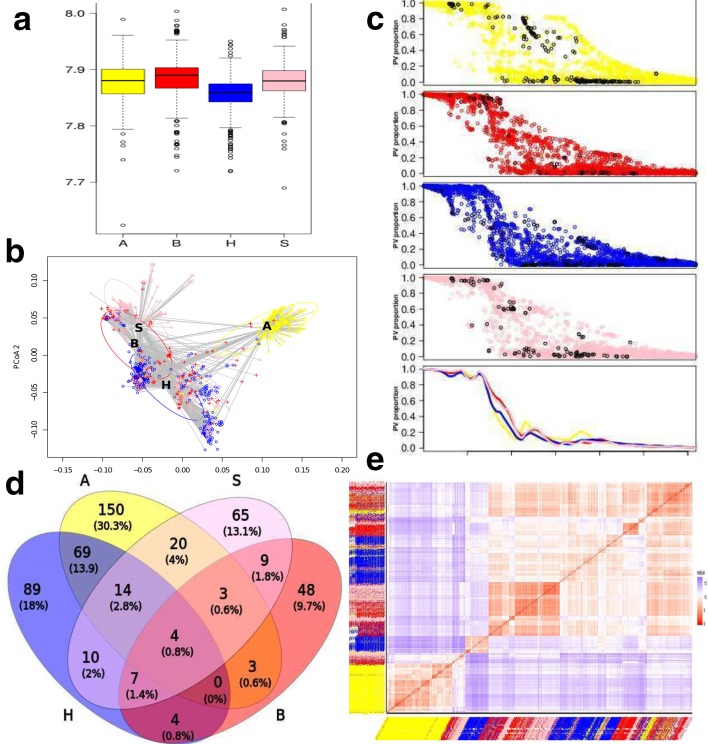
Fig. 1.
S. enterica serovar Typhimurium pangenome exploration. Colours represent host: avian (yellow), bovine (red), human (blue), swine (pink). (a) Shannon index calculated for each host based on differential PVs. (b) Beta-dispersions show multivariate homogeneity of isolates in each host. Non-Euclidean distances between objects were reduced to principal coordinates (x-axis and y-axis). Ellipses indicate 1 sd from each host centroid marked as a letter. (c) 4041 PVs (x-axis) and the proportions (y-axis) of presence vary between the different hosts (colours as defined above). Those PVs that are significantly associated with each host (as calculated by pangenome GWAS, Scoary) are plotted in black. The bottom panel shows best fit lines (Loess) for distribution of differential PVs from all hosts. (d) Numbers of PVs significantly associated with host and overlap of differential PVs between the hosts. (e) Ordered dissimilarity matrix based on differential PVs. Heatmap colours: red (high) and blue (low) similarity. Labels are coloured by host.

