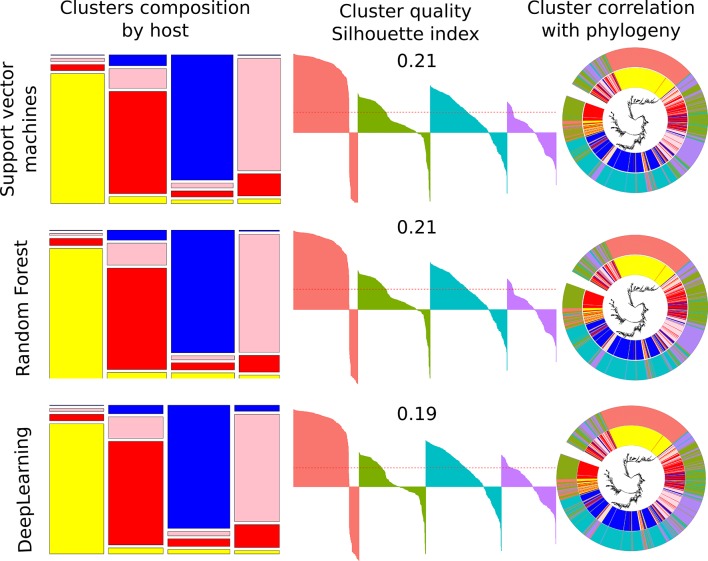
Fig. 4.
Supervised ML. The colours represent host: avian (yellow), bovine (red), human (blue), swine (pink). The first column of the figure shows the cluster’s relative size and composition by host. The second column demonstrates silhouette index cluster assessment, where each of the four clusters are coloured differently and each isolate is drawn as a bar with its allocated value between −1 to 1. The mean value of all individual indexes is given on top of the silhouette cluster and also denoted as a red dotted line through each graph. The clusters are drawn in the same order as those from the first column. The third column illustrates cluster correlation with phylogeny (accessory genome tree) with the inner ring depicting the host of isolation and the outer ring the supervised ML clusters based on the four group allocation.

