-
A
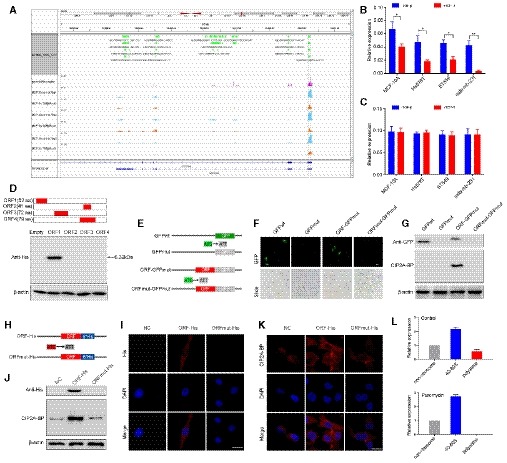
Ribosome occupancy map at the LINC00665 locus. MCF‐10A cells were either mock‐treated or treated with TGF‐β, and ribosome profiling on three biological replicates was shown.
-
B
Relative levels of CIP2A‐BP were determined by polysome profiling and qRT–PCR in MCF‐10A and TNBC cells either mock‐treated or treated with TGF‐β.
-
C
Relative levels of LINC00665 were determined by qRT–PCR in MCF‐10A and TNBC cells either mock‐treated or treated with TGF‐β.
-
D
Upper: putative ORFs in LINC00665. Lower: The ORFs were constructed into pcDNA3.1 vector and transfected to MCF‐10A cells for 24 h. The ORFs‐His fusion proteins were determined by Western blot with anti‐His antibody.
-
E
Diagram of the GFP fusion constructs. The start codon ATGGTG of the GFP (GFPwt) gene is mutated to ATTGTT (GFPmut). The start codon ATG of the LINC00665 ORF is mutated to ATT.
-
F, G
The indicated constructs were transfected into MCF‐10A cells for 24 h; then, the GFP fluorescence was detected using fluorescence microscope (F); and fusion protein levels were determined by Western blot with anti‐GFP and anti‐CIP2A‐BP antibodies, respectively (G).
-
H
Diagram of the His fusion constructs. The start codon ATG of the LINC00665 ORF is mutated to ATT.
-
I–K
The indicated constructs were stably expressed in MDA‐MB‐231 cells; micropeptide CIP2A‐BP was immunostained using anti‐His (I) and anti‐CIP2A‐BP antibodies (K), respectively; and CIP2A‐BP–His fusion protein levels were determined by Western blotting with anti‐His and CIP2A‐BP antibodies (J).
-
L
MCF‐10A cells incubated in the absence or presence of puromycin (200 μM) were fractionated on sucrose gradients, and distribution of CIP2A‐BP transcripts was quantified by qPCR.
Data information: Data are representative of three independent experiments (B, C, and L). Data were assessed by paired Student's
‐test (B and C) and are represented as mean ± SD. *
< 0.01. Scale bars: 10 μm (F), 20 μm (I and K).

