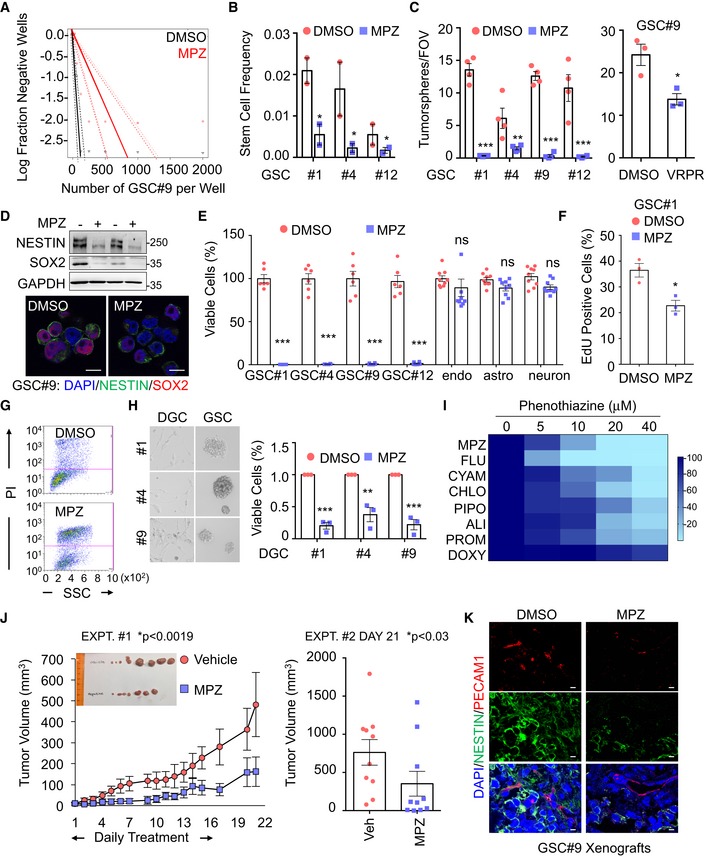
Linear regression plot of in vitro limiting dilution assay (LDA) for GSC#9 treated with MALT1 inhibitor, mepazine (MPZ, 20 μM, 14 days). DMSO vehicle was used as a control. Data are representative of n = 2.
Stem cell frequency was calculated from LDA in GSCs #1, #4, and #12 treated with MPZ treatment (20 μM, 14 days). Data are presented as the mean ± SEM on two independent experiments.
Tumorspheres per field of view (fov) were manually counted in GSCs #1, #4, #9, and #12 in response to MPZ (20 μM) and vehicle (DMSO), and in GSC#9 treated with Z‐VRPR‐FMK (75 μM) and vehicle (H2O) for 4 days. Data are presented as the mean ± SEM on 4 independent experiments for MPZ and three independent experiments for Z‐VRPR‐FMK.
The expression of the stemness markers SOX2 and NESTIN was evaluated by Western blot and immunofluorescence (SOX2 in red NESTIN in green) in MPZ (+, 20 μM, 16 h) and vehicle (−, DMSO, 16 h) treated GSC#9. GAPDH served as a loading control. Scale bar: 10 μm.
Cell viability was measured using Cell TiterGlo luminescent assay in GSCs #1, #4, #9, and #12, human brain endothelial cells (endo), human astrocytes (astro), and human neuron‐like cells (neuron) treated for 48 h with DMSO or MPZ (20 μM). Data were normalized to their respective DMSO‐treated controls and are presented as the mean ± SEM of three independent experiments in triplicate.
FACS analysis of EdU staining was performed on GSC#1 treated overnight with MPZ (10 μM). Data are presented as the mean ± SEM on three independent experiments.
FACS analysis of propidium iodide (PI) incorporation in GSC#9 treated for 48 h with vehicle (DMSO) or MPZ (20 μM).
Cell viability was measured using Cell TiterGlo luminescent assay in differentiated GSC#1 #4, and #9 (DGCs) treated for 48 h with vehicle (DMSO) or MPZ (20 μM). Data were normalized to their respective DMSO‐treated controls and are presented as the mean ± SEM of three independent experiments. Morphology of GSCs #1, #4, #9, and DGCs #1, #4, #9 was shown using brightfield images.
Heatmap of cell viability of GSC#9 using increasing doses (0, 5, 10, 20, 40 μM) of phenothiazines: mepazine (MPZ), fluphenazine (FLU), cyamemazine (CYAM), chlorpromazine (CHLO), pipotiazine (PIPO), alimemazine (ALI), promethazine (PRO), and doxylamine (DOXY). Data were normalized to their respective DMSO‐treated controls.
Nude mice were implanted with GSC#9 (106 cells) in each flank, and randomized cages were treated with either vehicle (DMSO) or MPZ (8 mg/kg) daily i.p., for 14 consecutive days, once tumors were palpable. Tumor volume was measured from the start of treatment until 1 week after treatment was removed. Graph of tumor volume on day 21 post‐treatment is presented. Data are presented as the mean ± SEM n = 10/group.
Cryosections from GSC‐xenografted tumors were stained for the endothelial marker PECAM1 (red) and tumor marker NESTIN (green). Nuclei (DAPI) are shown in blue. Scale bar: 20 μm.
= 3, unless specified. Statistics were performed using a two‐tailed
‐test with a 95% confidence interval for panels (B, C, E, F, H), a two‐way ANOVA with Bonferroni post‐test at 95% confidence interval for panel (J), a Wilcoxon–Mann–Whitney test for Expt #2 with
‐values stated for panel (J). *
< 0.001.

