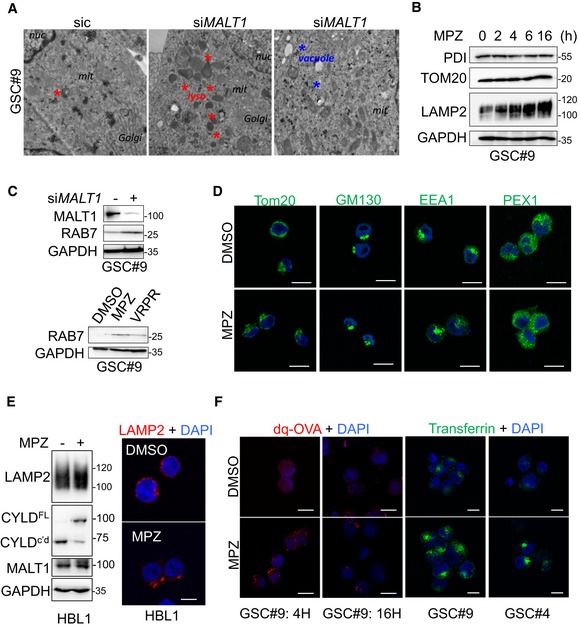
Transmission electron microscopy images from GSC#9 transfected with non‐silencing duplexes (sic) or siRNA duplexes targeting MALT1 (siMALT1). Multiple images and sections from one experiment were analyzed. Red stars denote lysosomes; blue stars vacuoles.
Western blot analysis of PDI, TOM20, and LAMP2 in total protein lysates from GSC#9 treated vehicle (DMSO) or MPZ (20 μM) for the indicated times. GAPDH serves as a loading control.
Western blot analysis of RAB7 and MALT1 in GSC#9 in total protein lysates from GSC#9 transfected with non‐silencing duplexes (sic) or siRNA duplexes targeting MALT1 (siMALT1). Alternatively, GSC#9 received Z‐VRPR‐FMK (VRPR, 75 μM, 16 h) and mepazine (MPZ, 20 μM, 16 h). GAPDH serves as a loading control.
Confocal analysis of TOM20, GM130, EEA1, and PEX1 immunostaining (green) in GSC#9 treated with vehicle (DMSO) or MPZ (20 μM) for 4 h. Nuclei (DAPI) are shown in blue. Scale bars: 10 μm.
ABC DLBCL lymphoma cells HBL1 treated with vehicle (DMSO) or MPZ (20 μM) for 4 h. (Left) Western blot analysis of LAMP2 and CYLD (full length, FL, or cleaved, c'd) in total protein lysates. MALT1 and GAPDH serve as loading controls. (Right) Confocal analysis of LAMP2 (red). Nuclei (DAPI) are shown in blue. Scale bars: 10 μm.
Confocal analysis of dq‐ovalbumin (dq‐OVA, red) in GSC#9 treated with vehicle (DMSO) or MPZ (20 μM) for 4 or 16 h. Nuclei (DAPI) are shown in blue. Alternatively, confocal analysis of transferrin uptake (green) in GSC#9 and GSC#4 treated with vehicle (DMSO) or MPZ (20 μM) for 4 h. Nuclei (DAPI) are shown in blue. Scale bars: 10 μm.
Data information: All data were repeated in three independent experiments, unless specified.

