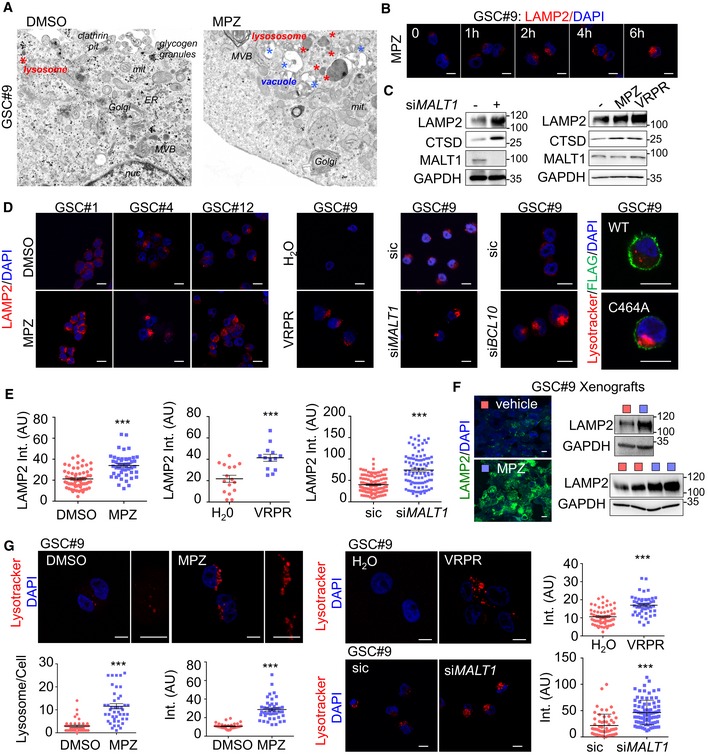
Transmission electron microscopy of GSC#9 treated with vehicle (DMSO) or MPZ (20 μM) for 16 h. ER: endoplasmic reticulum; MVB: multivesicular bodies; lys: lysosome; mit: mitochondria; nuc: nucleus. Red stars denote lysosomes; blue stars vacuoles.
Confocal analysis of LAMP2 staining (red) at 0, 1, 2, 4, and 6 h post‐MPZ (20 μM) treatment. Nuclei (DAPI) are shown in blue. Scale bar: 10 μm.
Western blot analysis was performed in total protein lysates from GSC#9 transfected with non‐silencing duplexes (sic) or MALT1 targeting siRNA duplexes (siMALT1). Alternatively, Western blot analysis of LAMP2, CTSD, and MALT1 was done in total protein lysates from GSC#9 treated for 16 h with MPZ (20 μM) or Z‐VRPR‐FMK (75 μM). DMSO was used as vehicle. GAPDH served as a loading control.
Confocal analysis of LAMP2 staining (red) in GSCs #1, #4, #12 treated for 16 h with vehicle (DMSO) or MPZ (20 μM). Alternatively, GSC#9 were either treated for 16 h with H2O or Z‐VRPR‐FMK (75 μM). Additionally, cells were transfected with non‐silencing duplexes (sic) or MALT1 and BCL10 targeting siRNA duplexes (siMALT1 and siBCL10). Alternatively, lysotracker staining (red) was used to track for lysosomes in either GSC#9 expressing either wild‐type (WT) or C464A FLAG‐MALT1 (green). Scale bar: 10 μm.
Quantification of LAMP2 staining pixel intensity on GSC#9 treated as described in panel (D). Data are presented as the mean ± SEM on three independent experiments. Each dot represents one cell. n > 30.
Cryosections from GSC#9‐xenografted tumors in vehicle and MPZ‐challenged animals (as described in Fig
2J) and assessed for LAMP2 staining (green). Nuclei (DAPI) are shown in blue. Scale bar: 10 μm. Western blot analysis of LAMP2 was performed in tumor lysates. GAPDH served as a loading control.
Confocal analysis of lysotracker staining (red) in GSC#9 treated for 16 h with vehicle (DMSO) or MPZ (20 μM). Alternatively, GSC#9 were either treated for 16 h with H2O or Z‐VRPR‐FMK (75 μM) (upper panel) or transfected with sic and siMALT1 (bottom panel). As indicated, number of lysotracker‐positive puncta and lysotracker pixel intensity (arbitrary unit, AU) were quantified per cell. Data are presented as the mean ± SEM on three independent experiments. Each dot represents one cell. n > 30. Nuclei (DAPI) are shown in blue. Scale bars: 10 μm.
= 3, unless specified. Statistics were performed using a two‐tailed
‐test with a 95% confidence interval. ***
< 0.001.

